@tomaskir said in graphs on stack:
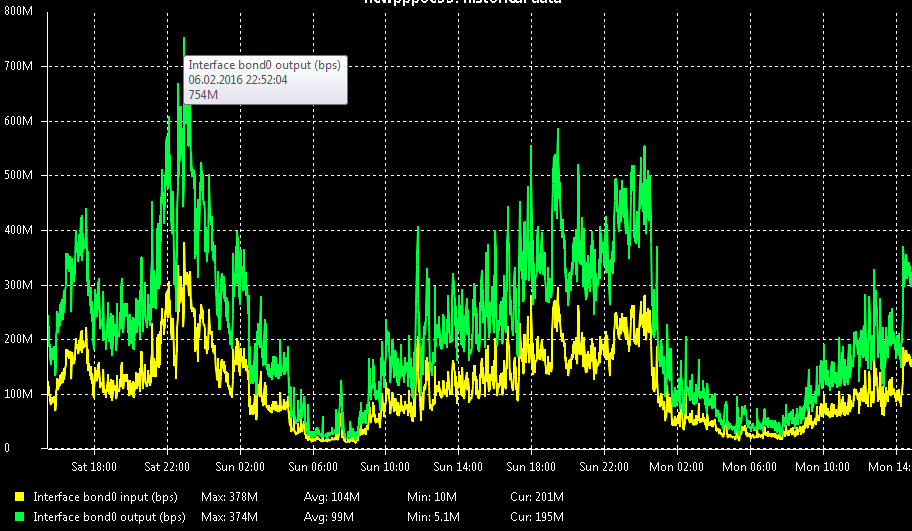
The legend shows each DCI separately.
So the legend correctly states avg. for each DCI.
If you stack the graphs, on the graph itself, you will of course see totaled (stacked) result.
For area and gradient, its all in the graph properties.
You can watch this video, it covers almost all graphing options available in NetXMS:
https://youtu.be/iIAAIUp9Wd0
You're talking about the predefined graphs, I mean, right-click mouse DCI - Line chart. - How can we make the gradient or the area?
Yes, graph in stack mode, i understood 378+374=752 - on graph this is 754 almost identical. But why do I see the value of it to the inbound interface, if it is the total?