Skip to content

Support

5.1k Topics 22.0k Posts

Questions about installing, configuring and using NetXMS.

  • Auto-link Nodes feature seems broken after upgrade to 6.2.5

    3
    0 Votes
    3 Posts
    1k Views
    A
    Hi, Confirmed, this is a bug in the 6.2 management client, not in the server or your setup. Since 6.2.0 the Auto-link action sends an empty node list to the server, so it reports success and creates nothing. Layer 2 maps are not affected because their links are built by the server from topology data. Fix is tracked in https://github.com/netxms/netxms/issues/3681 and will be in the next 6.2 release. Until then, "Link objects" still works, but it links two objects at a time and doesn't bind the link to interfaces.
  • Node User Sessions tab error

    5
    0 Votes
    5 Posts
    13k Views
    S
    Great! Thanks Alex.
  • Jetty12 with nxmc-6.2.4.war | NoClassDefFoundError: javax/servlet

    3
    0 Votes
    3 Posts
    14k Views
    T
    Hello Alex, you are right. My mistake was that I downloaded the wrong file, now it works as expected. Thank you
  • Process.Count returns 0 even EXE is running

    4
    0 Votes
    4 Posts
    14k Views
    A
    Yes, it's already fixed in the code and will be in 6.2.6, which isn't released yet: https://github.com/netxms/netxms/issues/3656. Only the agent on the Windows machine needs to be updated.
  • Repeated updates of the software inventory since version 6.0.0 of Win Agent

    18
    0 Votes
    18 Posts
    144k Views
    A
    Hi, Still not fixed - nothing in 6.2.4 or 6.2.5 changed this part of the agent. Remaining problem is now tracked in https://github.com/netxms/netxms/issues/3621 (#3137 was closed after the split). To move it forward, please post: exact warning lines from the server log - package name in them shows which part of the agent produces the duplicates nxagentd log with debug level 6 for tag "winnt", covering a full logon and logoff System.InstalledProducts table taken twice - once with a user logged on, once without whether these are RDS/terminal servers, and whether profiles are roaming, FSLogix or UPD
  • Server crash opening one dashboard

    7
    0 Votes
    7 Posts
    25k Views
    S
    Great job, thanks everyone! Alessio.
  • OpenSSL Vulnerabilities

    4
    0 Votes
    4 Posts
    32k Views
    S
    Thank you Victor and Alex.  I appreciate the response!
  • Script based DCIs broken after update

    3
    0 Votes
    3 Posts
    20k Views
    N
    Thanks for the info, after reading the docs about Agent External Metrics I converted the actions to shell form metrics and now it works fine. (Before I read the docs I tried the format you provided, but that had some issues which didn't trigger an alarm so I have no idea what was wrong with that.)
  • 0 Votes
    3 Posts
    18k Views
    J
    Got it, thank you very much for your reply!
  • slack configuration

    3
    0 Votes
    3 Posts
    33k Views
    C
    Thank you for pointing me in the right direction, I had not created the webhook correctly.
  • The PinView feature is no longer working.

    5
    0 Votes
    5 Posts
    23k Views
    A
    Your fresh install working is the useful data point - this is something about that specific server, not the pinboard code. Here's what's actually happening: all web UI settings live in a single properties file on the machine running the web UI, under the servlet container's work directory, named nxmc.preferences.<uuid>. The uuid comes from a cookie called nxmcStoreId in your browser. If that cookie doesn't come back on the next login, the web UI generates a new uuid and opens an empty file - and the old one stays on disk with all your settings still in it. Pinboard, the "Show server clock" checkbox and column widths all live in that one file, which is why they go together. Three things to check, and they split the problem cleanly: How many contexts are deployed. Look at /var/lib/tomcat10/work/Catalina/localhost/ - if more than one nxmc context is there (nxmc and nxmc-6.2.4, say), each has its own state directory, and the files you find may belong to a context you are no longer using. The web UI logs a line "State directory:" at every startup naming the one actually in use. Whether a new file appears per login. List the state directory, log in again, list it again. A new nxmc.preferences.<uuid> each time means the cookie is not coming back. The same file with a new timestamp means it is, and the problem is elsewhere. The cookie itself. Browser dev tools, Application - Cookies, look for nxmcStoreId. It is set with a 90 day lifetime, so it should survive a logout. If your nginx config caches or strips Set-Cookie on the proxied responses, it won't. If you already have a file there containing pinboard$<number> entries, that settles most of it on its own: saving works, and the session that comes up empty is reading a different file. The web UI log goes to catalina.out on a Tomcat install - grep it for "State directory", "local preferences" and "Invalid store ID". (-Dnxmc.logfile is only set in our Jetty instructions, so on Tomcat everything lands in the console log.) Note: even once this works, that directory is Tomcat's per-context work directory and it is cleared on war redeploy. So web UI settings are lost on every web UI upgrade by design - that is likely part of what you saw across the three version upgrades.
  • 0 Votes
    3 Posts
    51k Views
    T
    Thanks Alex, super helpful.
  • Cannot create node object XXXX: License Violation

    3
    0 Votes
    3 Posts
    27k Views
    C
    Hi Alex, I've sent support an email. I believe I'll need a new license key as my Hardware ID is red.
  • Netxms Managment Client error on close

    3
    1
    0 Votes
    3 Posts
    22k Views
    A
    update: another issue is fixed. this one is tracked here: https://github.com/netxms/netxms/issues/3593
  • 0 Votes
    2 Posts
    31k Views
    A
    Hi, Confirmed, and thanks for tracing it - your reading is exactly right. When no multiplier applies the value stays a String, so the %s path skips the decimal trimming. Tracked as https://github.com/netxms/netxms/issues/3577. Until that's fixed, setting an explicit display format on the DCI works around it: %{m,u}.2f instead of leaving it empty. The f conversion parses the string into a number first, so the trimming happens. Cost is that it's per-DCI and pins you to two decimals regardless of magnitude.
  • Using script for title and group in Performance view

    2
    1
    0 Votes
    2 Posts
    31k Views
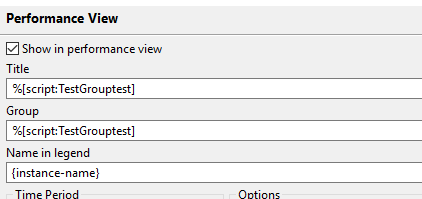
    A
    Hi, No - Title and Group do not take scripts. Neither field goes through a macro engine on the server: the whole Performance View block is stored with the DCI as-is, and the client substitutes a small fixed set of placeholders when it draws the tab. That is the entire mechanism, so there is nothing to hook a script into. Two separate things are off in the screenshot. % is a real macro syntax, but it belongs to the text expansion used for event and alarm messages, notification text and object tools - and there the form is %[scriptName], without the script: prefix. The script: prefix belongs to %{script:name}, which is a template macro for DCI name, description and instance fields, expanded when the DCI is created from a template - once per node, not per discovered instance. You combined the two, and neither engine is applied to Performance View fields. What the fields do accept, substituted by the client at render time: Title - {instance}, {instance-name}, {node-name} Group - {instance}, {instance-name} (no {node-name} here) Name in legend - {instance}, {instance-name}, {node-name} Leave Title or Name in legend empty and the DCI description is used instead. Charts are grouped by the substituted Group value, so instances that produce identical text land on one graph. For splitting instances into two or more groups there are two ways. Simplest approach is one master DCI per group: copy the instance discovery DCI, give each copy a fixed Group name, and let each instance filter script accept only the instances belonging to that group. The group stays static text and the script only decides membership, so each group can also have its own title, colors and time range. If you want to keep a single master DCI and let the script decide, use the instance display name as the carrier - the filter script sets it, and Group reads it back: if ($1 ilike "*volt*") return [true, $1, "Voltage"]; return [true, $1, "Current"]; Second element of the array is the instance value ({instance}), third is the instance display name ({instance-name}). Set both Group and Title to {instance-name} and Name in legend to {instance} - instances the script labelled "Voltage" end up on one graph titled Voltage, "Current" on another. Two caveats: {instance-name} then carries the group label everywhere it is shown, Last Values and DCI descriptions included, so use {instance} where you need the instance itself; and group matching is exact, case included. Filling these fields from a script is not possible today, and the macros that do work are not in the documentation - the Performance view section only mentions grouping by identical Group text. I raised https://github.com/netxms/netxms-doc/issues/69 to get them written down. If script-driven titles are important for your setup, say so and I will open a feature request for it.
  • How to monitor Proxmox ve with vmgr.nsm in agent config

    8
    0 Votes
    8 Posts
    143k Views
    A
    Hi, No problems, and running pvesh from the agent works fine. On the second question the choice isn't quite what it looks like though, because with NetXMS the REST API route is itself an agent feature. pvesh works from the agent for a reason worth knowing about: it invokes API functions directly without going through the REST/HTTPS server, and it requires root. The packaged agent runs as root - the systemd unit does not drop privileges, and the agent changes uid only if you pass -u/-g or set UserId/GroupId in nxagentd.conf. So it works with no extra setup, which also means anyone who can add a DCI can make the agent fork a root command on the hypervisor. Worth deciding that deliberately rather than finding it out later. What will actually bite you is process spawning. ExternalParameter (ExternalMetric in current naming) forks a process per metric per poll, and pvesh is a Perl program that loads the PVE API modules on every invocation. One metric per guest on a 60 second interval turns into a continuous stream of interpreter startups on the host. The default execution timeout is 5 seconds (ExecTimeout, or ExternalMetricTimeout for these specifically), and a slow pvesh call will hit it and get killed. Use ExternalDataProvider instead - added in 5.2.0. It runs the command once per polling interval, caches the output, and serves any number of metrics out of the cached document with jq queries, evaluated inside the agent so there is no jq binary to install: [ExternalDataProvider/PVE] Command = ["/usr/bin/pvesh", "get", "/cluster/resources", "--type", "vm", "--output-format", "json"] PollingInterval = 60 Timeout = 30000 [ExternalDataProvider/PVE/Metrics] PVE.Guest.Status(*) = .[] | select(.vmid == $1) | .status PVE.Guest.CPU(*) = .[] | select(.vmid == $1) | .cpu PVE.Guest.CPU(*).dataType = float PVE.Guest.Memory(*) = .[] | select(.vmid == $1) | .mem PVE.Guest.Memory(*).dataType = uint64 [ExternalDataProvider/PVE/Lists] PVE.Guests = .[] | .vmid That is one pvesh call a minute for the whole cluster no matter how many DCIs you build on top, and PVE.Guests gives you instance discovery over vmid. Two details: Timeout here is in milliseconds, and metrics with parameters ($1) need agent 6.0 or newer - on 5.2 define each metric with a fixed query instead. On agent versus REST: there is no version of the REST route that doesn't involve an agent. Web service DCIs are executed by an agent acting as web service proxy - the server never makes the HTTP request itself. If the node has no web service proxy configured it falls back to the zone proxy, and finally to the management server node, so "just using the REST API" in practice means "the server's own agent makes the call". The choice is which agent and where it sits, not whether there is one. Consequences: Responses are cached per URL for the retention time set on the web service definition, so every DCI reading out of the same document costs one HTTP request. Against /cluster/resources that is a single call per interval covering every guest in the cluster. The extraction is identical either way - web service DCIs and ExternalDataProvider share the same jq-based extractor, so the queries you write don't change with the route. Only an agent on the PVE host can reach 8006 on localhost, which matters if that port isn't open to the server. Poll from an agent elsewhere and you install nothing on the hypervisor at all. So the real trade is narrow. pvesh saves you managing an API token, at the price of forking a root-privileged Perl process on the hypervisor. The web service route costs you a token and gives you a read-only credential in exchange (PVEAuditor is enough), one HTTP call per interval, and the freedom to poll from an agent that isn't on the PVE host. I'd take the REST API as the default and keep pvesh for anything the HTTP API doesn't expose. One thing has changed since my post above. The OTLP route I said didn't work now does - the receiver accepted protobuf only, which is why PVE 9's OpenTelemetry metric server couldn't reach it, and that is fixed in 6.2.3 (https://github.com/netxms/netxms/issues/3482), released on 9 August. On 6.2.3 or later you can point Datacenter - Metric Server - OpenTelemetry straight at the NetXMS web API and have PVE push guest metrics on its own: no collector in between, no polling, and no agent on the host. It needs an auth token passed through the otel-headers option, and the receiver is loaded as a server module (Module = otlp in netxmsd.conf). None of the ingestion side is documented yet - https://github.com/netxms/netxms-doc/issues/67 covers that.
  • How to use setCustomAttribute

    3
    0 Votes
    3 Posts
    38k Views
    D
    Perfect, thank you for the explanation.
  • Agent unreachable after few Minutes

    3
    0 Votes
    3 Posts
    62k Views
    T
    Hi Alex, Thanks for the detailed explanation. The problem was caused by an offline network mount. After disabling the metric on the server and restarting the agent, it runs without any issues. One weird thing that happened while troubleshooting was that the command gdb -p $(pgrep nxagentd) --batch -ex 'thread apply all bt' > nxagentd-threads.txt  didn't generate thread information; it only displayed "[New LWP <process ID>]" lines.
  • help with NetXMS

    11
    0 Votes
    11 Posts
    68k Views
    A
    Hi, Most likely the virtual interfaces are actually present as objects, and what's missing is only the DCIs for them - these are two separate mechanisms. Here's what's actually happening: NetXMS builds the interface list from the standard ifTable and creates interface objects for everything the device reports - VLAN, PPPoE, bridges and tunnels included, there is no filtering by type at that stage. So after a configuration poll they all should be visible in the Interfaces view under the node - I do believe they are there on your system? If some are genuinely missing even after configuration poll, that would mean RouterOS is not exposing them over SNMP, but that would be unusual. What filters them out is the Interface Traffic template itself. Its DCIs are created by instance discovery, and the filter script in the prototype DCIs only accepts interfaces with ifType 6, 7 or 22 (ethernet-like types). VLAN (ifType 135), PPP/PPPoE (23), tunnels (131), bridges (209) are all rejected by that check. The filter also skips loopbacks, interfaces whose expected state is not UP, and interfaces with speed at or below 20 Mbit/s. You can see it happening: run Poll -> Instance discovery on the node and look at the poller output - there will be a "skipped - interface type" line for every virtual interface. To include them, open the template under Templates -> Interface traffic, edit the instance discovery filter script in the prototype DCIs and extend the interfaceTypes array at the top with the types your virtual interfaces report: interfaceTypes = [6, 7, 22, 23, 131, 135, 209]; Actual ifType of every interface is shown on the interface object's Overview tab, so check there which values you need. Note: with default server configuration (Server.ImportConfigurationOnStartup = 1) your edits to this template survive server upgrades - stock templates are not overwritten on import. For CPU / temperature / voltage on MikroTik you don't need to hunt for OIDs manually: Health metrics - create DCI with origin "Network device driver". For MikroTik nodes the driver reads the RouterOS health gauge table and offers every gauge the particular model exposes (cpu-temperature, board-temperature, voltage, fan speeds, etc.) by name in the metric selection dialog. Values come exactly as the device reports them, so check the scale and add a transformation script if needed. CPU load - standard SNMP DCI on 1.3.6.1.2.1.25.3.3.1.2 (hrProcessorLoad from HOST-RESOURCES MIB, one row per core). Put these DCIs into your own template and let it apply automatically to all RouterOS devices with auto-apply filter script: return $node.driver == "MIKROTIK"; same idea as the custom attribute you already use for interface traffic, just keyed on the driver instead.