Skip to content

Feature Requests

706 Topics 2.0k Posts

Ideas and feature requests for NetXMS, in English or Russian — идеи и предложения можно писать на английском или русском.

  • Графики DPI - CPU и MEM

    russian
    2
    0 Votes
    2 Posts
    38k Views
    F
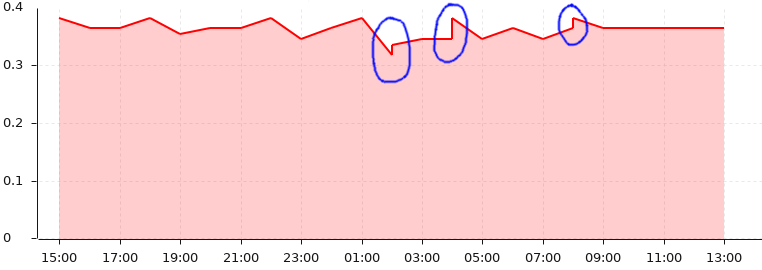
    На текущий момент NetXMS просто берет точки из базы данных и отрисовывает их на графике. Определение мест, когда данные не собираются - не такая простая задача, т.к. данные могу собираться по расписанию, или это вообще может быть push DCI про который сервер не знает, когда должны появиться следующие данные. В принципе это можно сделать - сохранять в базе отсчеты с некой отметкой "разрыв данных" и обрабатывать эти отметки при отрисовке графиков, но это не очень приоритетно и ресурсов на данный момент на это нет.
  • Улучшение карты сети

    russian
    1
    0 Votes
    1 Posts
    44k Views
    S
    Можно ли как-то включить автоматическое создание DCI для трафика на интерфейсах и подвязывать его на автоматически создаваемую карту сети? Было б оч удобно и наглядно мониторить скорость между узлами. Искал эту функцию через веб интерфейс, не нашел. Надеюсь такая функция появится в будущем либо мне, чайнику, обьянят как ее включить)
  • Index on syslog for container and/or subnet?

    3
    0 Votes
    3 Posts
    14k Views
    T
    For searches like that, I manually open the Syslog window and add my constraints before searching. That's for the same reason you mentioned: if you don't, it will go through the entire syslog table (even if it only returns the latest 4000 lines or something like that). A default to limit Syslog (and SNMP Trap and Event Log) output to anything newer than a configurable (Server Side? Client Side? Both?) interval would be a huge improvement for that.
  • Return threshold value and actual value in Threshold script

    1
    0 Votes
    1 Posts
    11k Views
    N
    I create Data Collection Configuration with threshold value is not fixed Transformation: return 10*log10($1/1000); Script: transport = CreateSNMPTransport($node); value = SNMPGetValue(transport, ".1.3.6.1.4.1.9.9.91.1.2.1.1.4." . $dci->instanceData . ".1"); threshold = 10*log10($value/1000); return (threshold > $1); I think it's better when i can return threshold value and actual value to the Event Message: return %(threshold > $1, format(threshold,1,2), format($1,1,2));
  • Select Object on Object Details

    1
    0 Votes
    1 Posts
    12k Views
    G
    When looking at the Alarm Browser, Summary Tables, and probably others, you can right click and choose Object Details. It would be helpful if the Object was selected in the Objects tree to easily identify which customer Container the Object is located.
  • 0 Votes
    2 Posts
    27k Views
    S
    Шарился по Ютуб и наткунлся на канал https://www.youtube.com/channel/UClfcU5ghesk9PtNQjWiFpEw Это Ваш официальный канал?
  • 0 Votes
    6 Posts
    49k Views
    Z
    Работает, мы используем для управления windows хостами. Разрабатываем код на рабочих станциях, в зависимости от того у кого какие предпочтения: Ubuntu Windows 10 + wsl
  • NetXMS + ELK Stack = 👍(!)

    russian
    2
    0 Votes
    2 Posts
    21k Views
    Z
    Думаю такая связка может быть вполне рабочей и без доработки функционала: syslog -> NetXMS (syslog forward) -> Logstash -> Elasticsearch. Но всё же проще filebeat, winlogbeat -> Elasticsearch.
  • Dashboard Templates

    2
    0 Votes
    2 Posts
    31k Views
    V
    Hi, no updates yet. Closest thing we have now is graph templates - can help in some situations. Best regards, Victor
  • Additional status code - down - achieved close enough equivalent

    11
    0 Votes
    11 Posts
    260k Views
    P
    Forgot to include what it actually looks like - on a dedicated 50 inch screen [image: allnetworkdown dashboard on a 50 inch screen.png]
  • Just a comment on NX-1642

    1
    0 Votes
    1 Posts
    28k Views
    P
    Both BIG-IP F5's and CITRIX Netscaler's imbed the ascii equivalent of the user defined field name as the trailing oids. You can see this in the walk data vs the text version ASCII 47.67.111.109.109.111.110.47    CHAR /Common/ Once I had worked that out, monitoring F5's and Netscaler's became much, much easier. Having it indexed would be even better. Lots of other things are like this - CISCO blade centre blades and thinks like that. From the archives: - ascii to char conversion https://ee.hawaii.edu/~tep/EE160/Book/chap4/subsection2.1.1.1.html I use CITRIX now, but for F5 snmp monitoring - it is  reasonable well documented here ==?  https://techdocs.f5.com/kb/en-us/products/big-ip_ltm/manuals/product/bigip-external-monitoring-implementations-13-1-0/13.html The only problem is that the mib with the indexed oids are in F5-BIGIP-LOCAL-MIB.txt - which they do not explain how to do the conversion - but they do explain everything else. The challenge here is that we selectively monitored the server / vserver / node tables for specifics such as UP or DOWN and if membership was 100%. Perhaps include a SNMP wizard that walks the mib, builds the various tables (ltmPoolMember is one example of a table we used), allowing the user to select which items in the table to monitor. Our way?  - walk the  whole mib - copy our virtual server name / paste into ascii converter - then copy the ascii string - paste it onto the end of the OID for that table that we wanted to monitor -
  • Additional input field type - list

    1
    0 Votes
    1 Posts
    12k Views
    P
    Now that my create help desk ticket object tool is working (right click on alarm ==> Tool ==> Create Service Desk Ticket), it could be improved by being able to provide a list of choices which a user could chose from then gets passed through from Display Name into Name for that field. I cannot depend on the user to type upper / lower case text that I want to populate that are case and wording specific -  I just want them to choose from a list. CA / Broadcom Service Desk Manager is pretty pedantic with its numerous mandatory fields and any spelling or case mismatch means no ticket created. Depending on which support group I would assign the ticket to, I would like to present a list of options on who to assign the ticket to.
  • Include Policies in import/export configuration

    2
    0 Votes
    2 Posts
    17k Views
    V
    This is done in upcoming 3.0 - policies combined with templates and can be exported and imported. Best regards, Victor
  • Link from certain dashboard-elements to object details of related nodes

    2
    0 Votes
    2 Posts
    18k Views
    F
    To add another point: This could also be implemented for the geographical map (World Map view). There, if you want to access the object details of a device you chose in the map, you need to navigate to "Service dependency", open its dropdown menu there and hit "Show Object details". I think, it would be nice to have the dropdown menu entry "Show Object Details" by default available. Maybe even not only in dashboards and geo-maps, but in every occasion, where you can open a dropdown menu for a specific object. Kind regards, fbu
  • 0 Votes
    1 Posts
    25k Views
    S
    Доброго времени суток. Предлагаю реализовать в netXMS функцию автоматическая инвентаризация которая формирует список пк определяя какие машины в домене а какие в рабочей группе. Далее формирует список который можно редактировать(количество планок ОЗУ, обьем, тип памяти и т.д) в самой программе и сохранить файл в формат exel или txt Что-то вроде этого [image: idea.jpg]
  • "Update" option for nxpush/nxapush

    1
    2
    0 Votes
    1 Posts
    14k Views
    F
    Dear NetXMS team, as requested by Victor in my previous post under 'General Support' (https://www.netxms.org/forum/general-support/multiple-values-assigned-to-same-timestamp-with-nxapush/), I now post this topic as a feature request. To sum up my point: I try to use nxapush to update DCI values at given timestamps, which results in multiple values being assigned to the same timestamp, as seen in the two screenshots attached to this post. My idea would be to have an option (maybe -u) indicating that any value currently assigned to the given timestamp should be deleted and replaced by the new value, allowing a more flexible use of both nxpush and nxapush. Best regards, fbu [image: double_value_assign.png] [image: multiple_value_assign1.png]
  • debug tags for trace in nxsl

    2
    0 Votes
    2 Posts
    16k Views
    P
    Similar request - being able to debug by node and or by function. For example - debug level 5 is needed to see why event accepted / rejected - but I only need that on for 1 node - not every node and every event. Currently example - PowerShell executable runs locally bit not on server - turn on debug and huge amount of irrelevant logging produced. Would be nice to say debug Object_Tool level 9 and even nice Debug Object Tool scriptxwz level 9
  • Пошаговая установка NetXMS 2.2.17 на Centos 7.6

    russian
    1
    0 Votes
    1 Posts
    31k Views
    S
    Доброго времени суток! Прошу создать РАБОЧУЮ, комплексную и пошаговую инструкцию для установки с репозитариев NetXMS сервера с БД и агентом. Потому что официальная инструкция с оф. сайта к сожалению, не приводит к установке.
  • 0 Votes
    1 Posts
    14k Views
    F
    Hi, currently, if you want to display in a dashboard how the values of a certain DCI developed during a certain period of time, you use a line chart. I think it would be cool, if it was possible to do something similar with bar- and tube-charts, as well. Maybe even give the possibility to define intervals in which the period should be split up to and how the data in these intervals should be accumulated. E.g.: Something like - "For the period of the last 8 months, display the sum of all data of each individual month", resulting in a chart similar to this: https://preply.com/wp-content/uploads/2018/08/representation-bar-graph.png. Kind regards, fbu
  • 0 Votes
    5 Posts
    43k Views
    P
    For anyone coming from another product with Alarm viewing capabilities that are selectable, this functionality is pretty important if not a show stopper. for those that have not - you do not know what you are missing. I currently have 4 Alarm viewers (including NetXMS). Two have no customising - this includes NetXMS One has basic column selection but no column ordering - frustrating. One has everything - absolutely everything. Column section, column ordering, preset filtering, severity filtering, separate settings for Alarms, Events, Explorer(Tree), Interfaces. The preference setting screen is attached - see for yourself!!. So why go NetXMS if I have the above? - the other product's DCI equivalent monitoring is appalling and as I can display NETXMS alarms per container and filter in "Outstanding" - I have a minimum workable solution with NetXMS. [image: alarm and event view - individual preferences example - customise everything.png]