
Making bar and tube charts able to display trend data for a given period of time
-
Hi,
currently, if you want to display in a dashboard how the values of a certain DCI developed during a certain period of time, you use a line chart.
I think it would be cool, if it was possible to do something similar with bar- and tube-charts, as well.
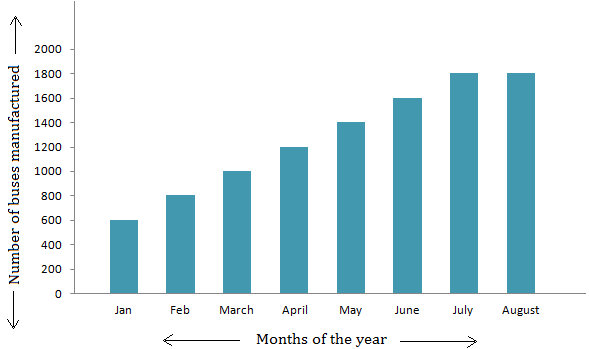
Maybe even give the possibility to define intervals in which the period should be split up to and how the data in these intervals should be accumulated.
E.g.: Something like - "For the period of the last 8 months, display the sum of all data of each individual month", resulting in a chart similar to this:
https://preply.com/wp-content/uploads/2018/08/representation-bar-graph.png.Kind regards,
fbu
Hello! It looks like you're interested in this conversation, but you don't have an account yet.
Getting fed up of having to scroll through the same posts each visit? When you register for an account, you'll always come back to exactly where you were before, and choose to be notified of new replies (either via email, or push notification). You'll also be able to save bookmarks and upvote posts to show your appreciation to other community members.
With your input, this post could be even better 💗
Register Login