
Line Graph X-Axis Labels
-
I'm running NetXMS version 1.2.11.
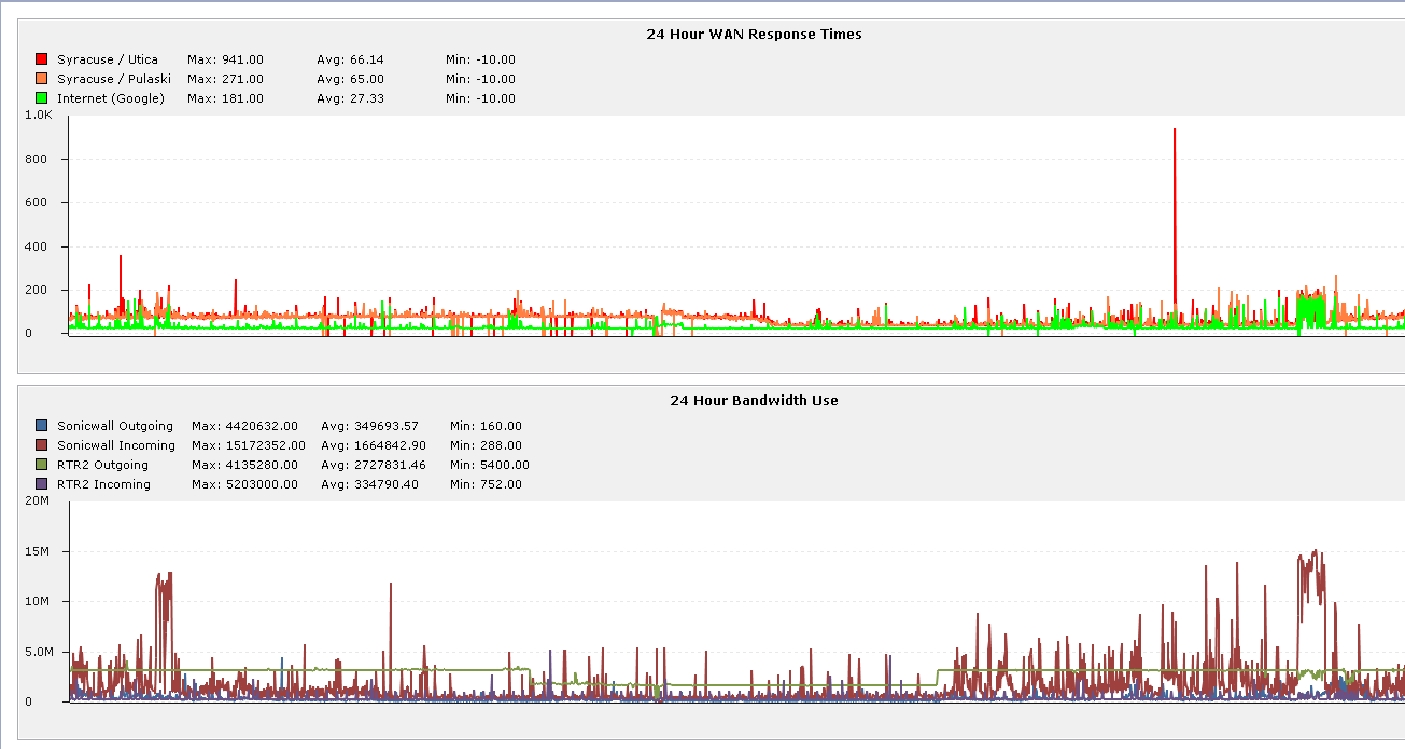
I have a few traffic graphs made up for dashboards so that I can see any issues over a 24 hour period. My problem is that, no matter how I configure them, I cannot get the time scale/hashmarks to display along the bottom (X-Axis).
I understand it's a long time period, but I would expect NetXMS to auto-scale the text and hashmark spacing to a reasonable level and display it.
I also looked through the xml and see no options for this.
Am I missing something?
-
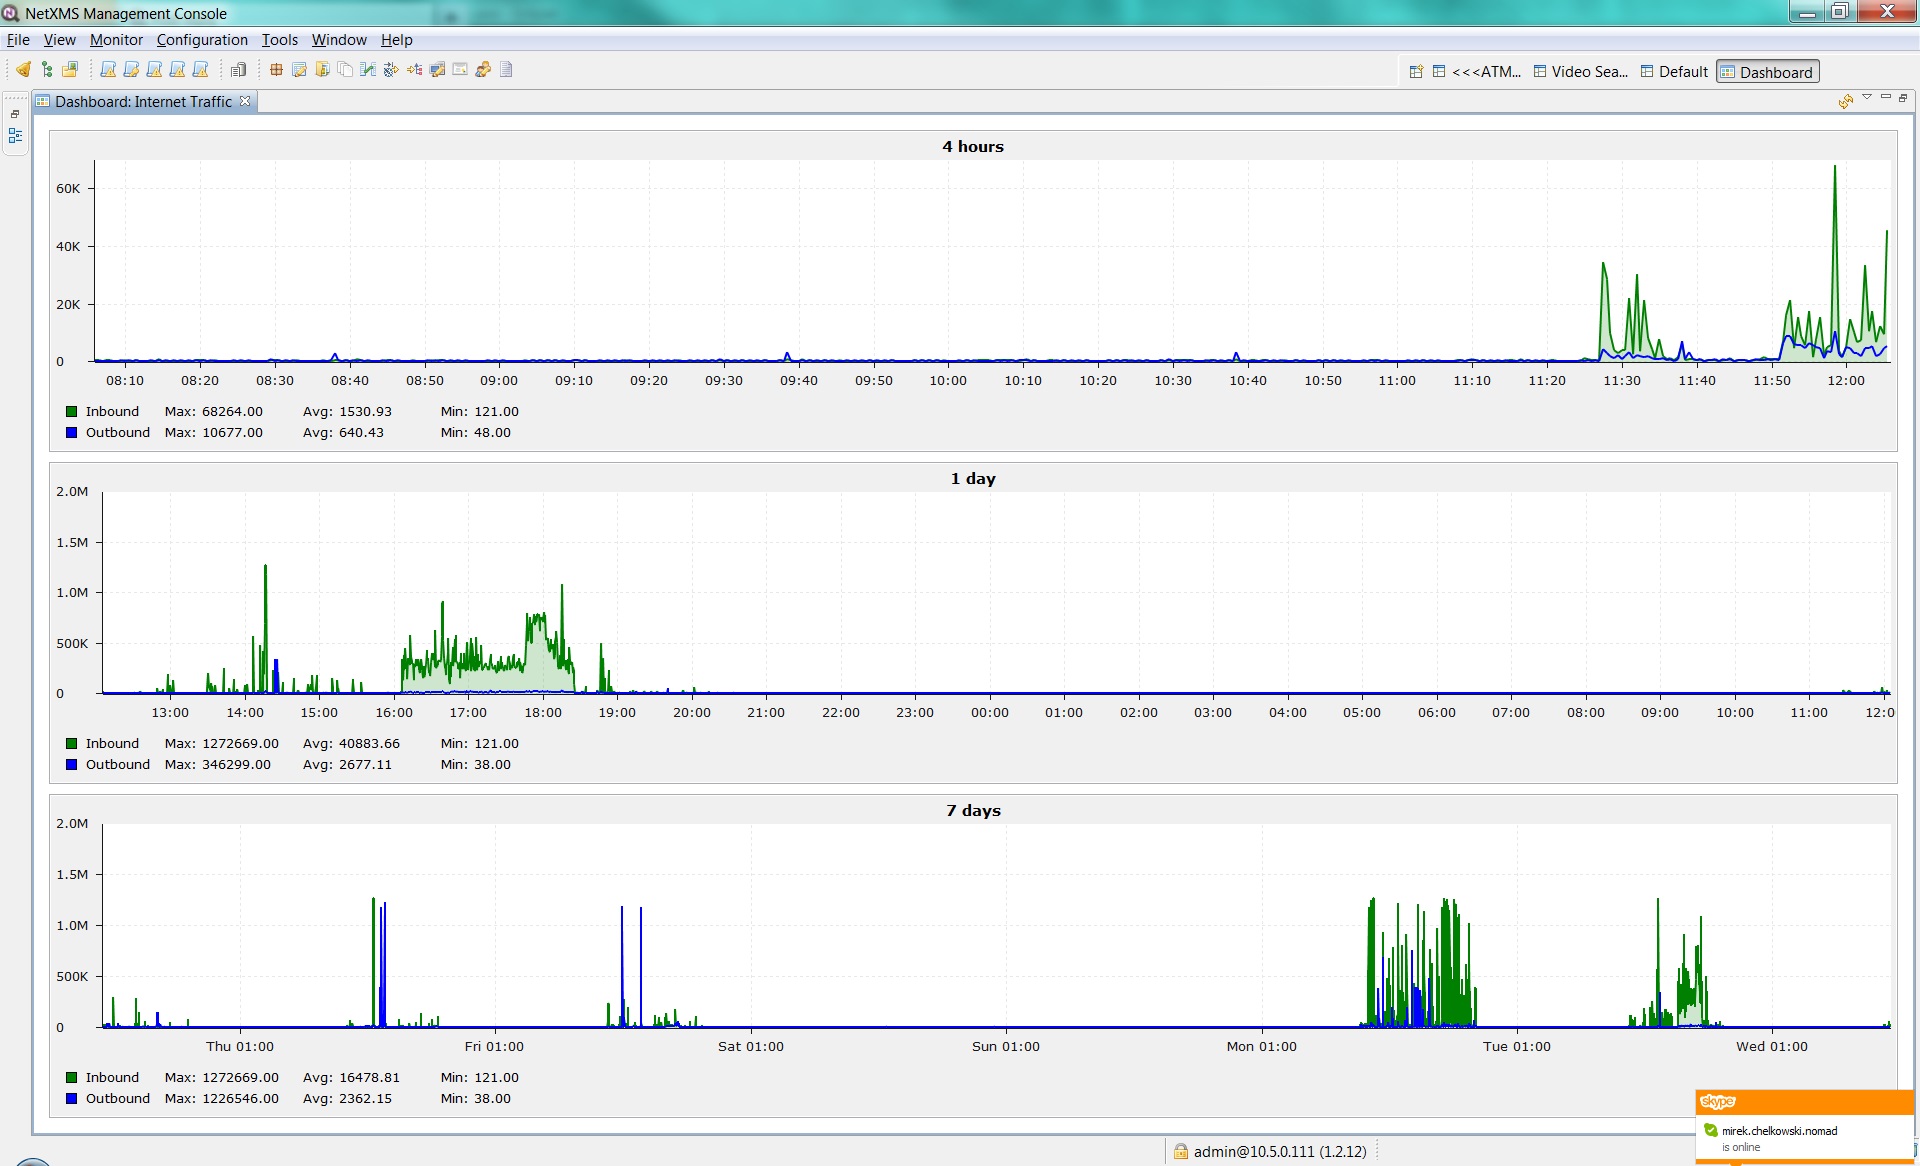
It should be like this. Attached is an example dashboard from my system showing line charts for different periods. Can you share a screenshot how it looks like on your system?
Best regards,
Victor
-
Hello! It looks like you're interested in this conversation, but you don't have an account yet.
Getting fed up of having to scroll through the same posts each visit? When you register for an account, you'll always come back to exactly where you were before, and choose to be notified of new replies (either via email, or push notification). You'll also be able to save bookmarks and upvote posts to show your appreciation to other community members.
With your input, this post could be even better 💗
Register Login