
about housekeeper
-
Hi.
If I don't misunderstand, housekeeper deletes old records of DCIs which are older then retention time.I have a big system and like to record nearly all possible information about my system. So, there are lots of DCIs and polling frequency is high.
My nextxms installation is working so good. But after 02:00 (Housekeeper's start time) system's db writing performance is getting too slow. When I look up to queues, I see lots of data at Database Writers sections (IData, RawDataand other). This queue sometimes going down in short time. But sometimes, Queue can go down to 0 nearly 20:00 pm. So, till queues go down to 0, all of my dashboards are not showing full.
I and using postgresql, linux. Postgresql tuning is ok. My server's configuration is Hp proliant DL380 gen 6. 2 CPUs, 32 GB ram and hp 410i raid card with 256 MB of cache. I am using 4 hdd with raid. Virtual platform on this pc and only one VM (nextms server) (sometimes I am trying wrong things and in VM, I can quickly backup and restore
 )
I am looking to disc performance of pc, and can go about 120 MBps but usage is about 5,5MBps.Is this problem about housekeeper or my hardware or anything else?
Does anybody has any idea about?Thanks.
-
What version of NetXMS you are using? It was a known bottleneck and we did a major optimisation in 2.0-M3.
-
-
Can you please enable slow query logging (>1sec, for example) and post explain here (or send it to [email protected])?
If it's delete query (most likely), you can do it in transaction and roll it back:BEGIN; EXPLAIN ANALYZE DELETE FROM idata_…; ROLLBACK; -
these are some of them :
LOG: duration: 38916.787 ms statement: DELETE FROM idata_4087 WHERE (item_id=4715 AND idata_timestamp<1420069290) OR (item_id=4716 AND idata_timestamp<1420069290) OR (item_id=4835 AND idata_timestamp<1420069290) OR (item_id=799 AND idata_timestamp<1433029290) OR (item_id=4830 AND idata_timestamp<1420069290)
LOG: duration: 25737.620 ms statement: DELETE FROM idata_4090 WHERE (item_id=4699 AND idata_timestamp<1420069329) OR (item_id=4698 AND idata_timestamp<1420069329) OR (item_id=4909 AND idata_timestamp<1420069329) OR (item_id=4904 AND idata_timestamp<1420069329) OR (item_id=800 AND idata_timestamp<1433029329)
LOG: duration: 30253.926 ms statement: DELETE FROM idata_4093 WHERE (item_id=4752 AND idata_timestamp<1420069355) OR (item_id=4751 AND idata_timestamp<1420069355) OR (item_id=4881 AND idata_timestamp<1420069355) OR (item_id=4888 AND idata_timestamp<1420069355) OR (item_id=801 AND idata_timestamp<1433029355)
LOG: duration: 25967.450 ms statement: DELETE FROM idata_4094 WHERE (item_id=4621 AND idata_timestamp<1420069385) OR (item_id=4622 AND idata_timestamp<1420069385) OR (item_id=4900 AND idata_timestamp<1420069385) OR (item_id=4890 AND idata_timestamp<1420069385) OR (item_id=802 AND idata_timestamp<1433029385)
LOG: duration: 31979.821 ms statement: DELETE FROM idata_4095 WHERE (item_id=4675 AND idata_timestamp<1420069411) OR (item_id=4674 AND idata_timestamp<1420069411) OR (item_id=4878 AND idata_timestamp<1420069411) OR (item_id=4867 AND idata_timestamp<1420069411) OR (item_id=803 AND idata_timestamp<1433029411)
LOG: duration: 11051.021 ms statement: DELETE FROM idata_4103 WHERE (item_id=2013 AND idata_timestamp<1420069443) OR (item_id=2082 AND idata_timestamp<1420069443) OR (item_id=804 AND idata_timestamp<1433029443) OR (item_id=2050 AND idata_timestamp<1420069443) OR (item_id=2012 AND idata_timestamp<1420069443)
LOG: duration: 6661.263 ms statement: COMMIT
LOG: duration: 7484.775 ms statement: COMMIT
LOG: duration: 6031.884 ms statement: COMMIT
LOG: duration: 3175.104 ms statement: UPDATE thresholds SET current_state=0 WHERE threshold_id=46785
LOG: duration: 36858.129 ms statement: UPDATE alarms SET alarm_state=2,ack_by=0,term_by=0,last_change_time=1435621607,current_severity=3,repeat_count=564,hd_state=0,hd_ref='',timeout=0,timeout_event=43,message='In_142_EOBC0/0__EO0/0 veri alma hatasi olustu',resolved_by=0, ack_timeout=0 WHERE alarm_id=86086
LOG: duration: 3999.100 ms statement: COMMIT
LOG: duration: 1374.970 ms statement: COMMIT
LOG: duration: 1874.300 ms statement: COMMIT
LOG: duration: 2345.613 ms statement: UPDATE thresholds SET current_state=0 WHERE threshold_id=46783
LOG: duration: 2345.286 ms statement: UPDATE thresholds SET current_state=0 WHERE threshold_id=49659
LOG: duration: 2345.726 ms statement: UPDATE thresholds SET current_state=0 WHERE threshold_id=49047
LOG: duration: 26901.621 ms statement: UPDATE alarms SET alarm_state=2,ack_by=0,term_by=0,last_change_time=1435621607,current_severity=3,repeat_count=564,hd_state=0,hd_ref='',timeout=0,timeout_event=43,message='In_142_EOBC0/0__EO0/0 veri alma hatasi olustu',resolved_by=0, ack_timeout=0 WHERE alarm_id=86086
LOG: duration: 2021.212 ms statement: COMMIT
LOG: duration: 17929.845 ms statement: UPDATE alarms SET alarm_state=2,ack_by=0,term_by=0,last_change_time=1435621607,current_severity=3,repeat_count=564,hd_state=0,hd_ref='',timeout=0,timeout_event=43,message='In_142_EOBC0/0__EO0/0 veri alma hatasi olustu',resolved_by=0, ack_timeout=0 WHERE alarm_id=86086
LOG: duration: 2733.314 ms statement: COMMIT
LOG: duration: 2649.563 ms statement: COMMIT
LOG: duration: 2898.573 ms statement: COMMIT
LOG: duration: 77500.642 ms statement: UPDATE alarms SET alarm_state=2,ack_by=0,term_by=0,last_change_time=1435621607,current_severity=3,repeat_count=564,hd_state=0,hd_ref='',timeout=0,timeout_event=43,message='In_142_EOBC0/0__EO0/0 veri alma hatasi olustu',resolved_by=0, ack_timeout=0 WHERE alarm_id=86086
LOG: duration: 7623.949 ms statement: UPDATE alarms SET alarm_state=2,ack_by=0,term_by=0,last_change_time=1435621614,current_severity=3,repeat_count=564,hd_state=0,hd_ref='',timeout=0,timeout_event=43,message='In_142_EOBC0/0__EO0/0 veri alma hatasi olustu',resolved_by=0, ack_timeout=0 WHERE alarm_id=86086
LOG: duration: 33038.037 ms statement: UPDATE alarms SET alarm_state=2,ack_by=0,term_by=0,last_change_time=1435621607,current_severity=3,repeat_count=564,hd_state=0,hd_ref='',timeout=0,timeout_event=43,message='In_142_EOBC0/0__EO0/0 veri alma hatasi olustu',resolved_by=0, ack_timeout=0 WHERE alarm_id=86086
LOG: duration: 9872.400 ms statement: UPDATE alarms SET alarm_state=2,ack_by=0,term_by=0,last_change_time=1435621614,current_severity=3,repeat_count=564,hd_state=0,hd_ref='',timeout=0,timeout_event=43,message='In_142_EOBC0/0__EO0/0 veri alma hatasi olustu',resolved_by=0, ack_timeout=0 WHERE alarm_id=86086
LOG: duration: 22095.260 ms statement: UPDATE alarms SET alarm_state=2,ack_by=0,term_by=0,last_change_time=1435621607,current_severity=3,repeat_count=564,hd_state=0,hd_ref='',timeout=0,timeout_event=43,message='In_142_EOBC0/0__EO0/0 veri alma hatasi olustu',resolved_by=0, ack_timeout=0 WHERE alarm_id=86086when I try to explain analyse, pgsql says me
query result with .... rows discarded (usually 15). So I could see nothing. -
Even simple queries are taking ages (e.g. 10 seconds for update by PK).
What PostgreSQL version are you using? Please share your postgresql.conf.
Do you have battery installed on 410i? Is it in write-back or write-through mode?
What's your read-ahead settings for drives? Please also show output of "iostat -x 5 5". -
410i card has battery.
I double checked about write cache of 410i card, and sure that it is enabled.
My Postgresql version is 9.2.10
iostat output at 22:05 pm (Turkey)
Linux 3.10.0-229.4.2.el7.x86_64 (netxms) 07/01/2015 _x86_64_ (12 CPU)avg-cpu: %user %nice %system %iowait %steal %idle
5.42 0.00 7.44 5.63 0.00 81.50Device: rrqm/s wrqm/s r/s w/s rkB/s wkB/s avgrq-sz avgqu-sz await r_await w_await svctm %util
sda 0.15 14.33 32.14 95.79 916.54 1585.75 39.12 1.76 14.24 25.56 10.45 4.40 56.33
dm-0 0.00 0.00 0.00 0.01 0.00 0.03 8.00 0.00 337.80 41.81 383.36 7.20 0.01
dm-1 0.00 0.00 32.30 110.13 916.52 1585.69 35.14 3.81 26.08 29.87 24.97 3.96 56.36avg-cpu: %user %nice %system %iowait %steal %idle
3.19 0.00 2.87 0.17 0.00 93.77Device: rrqm/s wrqm/s r/s w/s rkB/s wkB/s avgrq-sz avgqu-sz await r_await w_await svctm %util
sda 12.60 5.60 4.80 179.80 70.40 1769.60 19.93 0.34 1.84 11.38 1.59 0.35 6.42
dm-0 0.00 0.00 14.40 0.00 57.60 0.00 8.00 0.13 9.22 9.22 0.00 1.15 1.66
dm-1 0.00 0.00 3.00 185.40 12.80 1769.60 18.92 0.33 1.76 12.67 1.58 0.25 4.72avg-cpu: %user %nice %system %iowait %steal %idle
5.99 0.00 4.78 0.05 0.00 89.18Device: rrqm/s wrqm/s r/s w/s rkB/s wkB/s avgrq-sz avgqu-sz await r_await w_await svctm %util
sda 0.00 1.20 17.00 51.80 172.00 672.00 24.53 0.25 3.57 13.75 0.23 1.08 7.42
dm-0 0.00 0.00 0.00 0.00 0.00 0.00 0.00 0.00 0.00 0.00 0.00 0.00 0.00
dm-1 0.00 0.00 17.00 53.00 172.00 672.00 24.11 0.25 3.51 13.76 0.22 1.05 7.38avg-cpu: %user %nice %system %iowait %steal %idle
3.14 0.00 2.72 0.02 0.00 94.12Device: rrqm/s wrqm/s r/s w/s rkB/s wkB/s avgrq-sz avgqu-sz await r_await w_await svctm %util
sda 0.00 58.20 0.80 98.80 3.20 1088.00 21.91 0.08 0.79 8.75 0.72 0.12 1.24
dm-0 0.00 0.00 0.00 0.00 0.00 0.00 0.00 0.00 0.00 0.00 0.00 0.00 0.00
dm-1 0.00 0.00 0.80 157.00 3.20 1088.00 13.83 0.13 0.82 8.75 0.78 0.08 1.26avg-cpu: %user %nice %system %iowait %steal %idle
6.81 0.00 5.43 0.05 0.00 87.71Device: rrqm/s wrqm/s r/s w/s rkB/s wkB/s avgrq-sz avgqu-sz await r_await w_await svctm %util
sda 0.00 43.40 0.40 169.60 1.60 2665.10 31.37 0.23 1.38 18.00 1.34 0.14 2.46
dm-0 0.00 0.00 0.00 0.00 0.00 0.00 0.00 0.00 0.00 0.00 0.00 0.00 0.00
dm-1 0.00 0.00 0.40 212.60 1.60 2664.80 25.04 0.31 1.47 18.00 1.44 0.11 2.44and attached postgresql.conf
I was using mysql, and this problem was occurring nearly always. Then, I tried to use postgresql. I don't have much information about postgresql tuning and try to find some information over internet. I see http://pgtune.leopard.in.ua web page, and made tuning with info on this site. There was no problem about 2-3 months. And now again occurred.
I will update iostat while queues are increasing.
02:35 am
[root@netxms ~]# iostat -x 5 5
Linux 3.10.0-229.4.2.el7.x86_64 (netxms) 07/02/2015 _x86_64_ (12 CPU)avg-cpu: %user %nice %system %iowait %steal %idle
5.41 0.00 7.34 5.53 0.00 81.72Device: rrqm/s wrqm/s r/s w/s rkB/s wkB/s avgrq-sz avgqu-sz await r_await w_await svctm %util
sda 0.16 14.41 33.02 96.21 932.96 1590.23 39.05 1.80 14.38 26.43 10.24 4.30 55.51
dm-0 0.00 0.00 0.00 0.01 0.01 0.03 8.00 0.00 331.62 37.99 383.36 7.09 0.01
dm-1 0.00 0.00 33.19 110.63 932.94 1590.18 35.09 3.80 25.79 30.53 24.37 3.86 55.54avg-cpu: %user %nice %system %iowait %steal %idle
5.90 0.00 4.56 7.86 0.00 81.68Device: rrqm/s wrqm/s r/s w/s rkB/s wkB/s avgrq-sz avgqu-sz await r_await w_await svctm %util
sda 8.80 4.80 667.40 99.20 21368.00 2549.20 62.40 39.54 51.76 59.03 2.89 1.30 100.00
dm-0 0.00 0.00 0.00 0.00 0.00 0.00 0.00 0.00 0.00 0.00 0.00 0.00 0.00
dm-1 0.00 0.00 673.60 104.00 21347.20 2549.20 61.46 40.31 52.02 59.57 3.12 1.29 100.00avg-cpu: %user %nice %system %iowait %steal %idle
4.03 0.00 3.10 8.34 0.00 84.54Device: rrqm/s wrqm/s r/s w/s rkB/s wkB/s avgrq-sz avgqu-sz await r_await w_await svctm %util
sda 1.20 68.80 313.80 259.20 10504.00 2950.90 46.96 12.79 22.02 36.72 4.21 1.75 100.00
dm-0 0.00 0.00 0.00 0.00 0.00 0.00 0.00 0.00 0.00 0.00 0.00 0.00 0.00
dm-1 0.00 0.00 315.20 328.00 10828.80 2950.90 42.85 12.96 19.94 36.84 3.69 1.55 100.00avg-cpu: %user %nice %system %iowait %steal %idle
5.97 0.00 4.71 8.18 0.00 81.14Device: rrqm/s wrqm/s r/s w/s rkB/s wkB/s avgrq-sz avgqu-sz await r_await w_await svctm %util
sda 2.40 23.40 260.00 271.00 10802.40 2856.00 51.44 19.58 35.37 65.30 6.65 1.88 100.00
dm-0 0.00 0.00 0.00 0.00 0.00 0.00 0.00 0.00 0.00 0.00 0.00 0.00 0.00
dm-1 0.00 0.00 287.60 294.40 11120.80 2856.00 48.03 20.09 33.06 59.49 7.24 1.72 100.00avg-cpu: %user %nice %system %iowait %steal %idle
3.72 0.00 2.93 8.22 0.00 85.13Device: rrqm/s wrqm/s r/s w/s rkB/s wkB/s avgrq-sz avgqu-sz await r_await w_await svctm %util
sda 11.40 5.40 656.20 52.60 28537.60 2595.20 87.85 41.57 59.58 62.26 26.21 1.41 99.96
dm-0 0.00 0.00 0.00 0.00 0.00 0.00 0.00 0.00 0.00 0.00 0.00 0.00 0.00
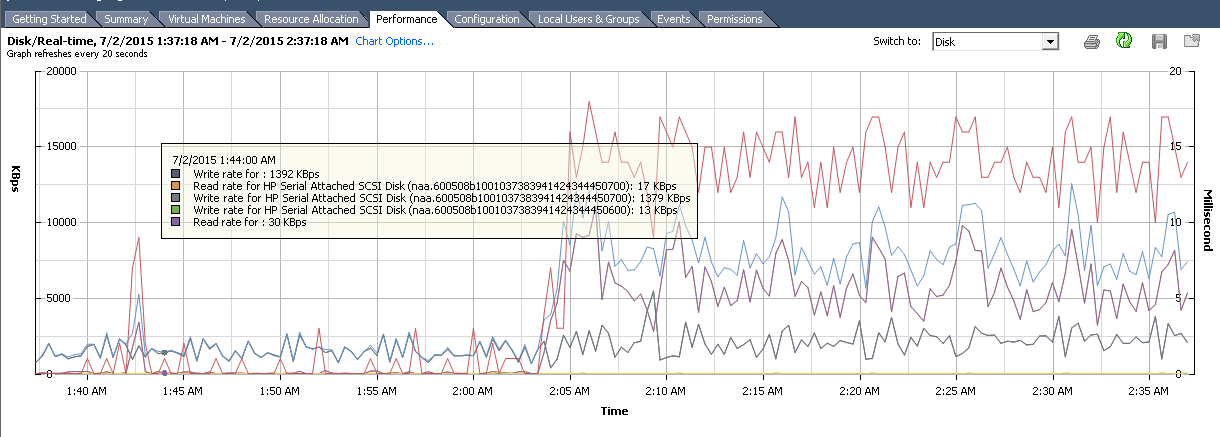
dm-1 0.00 0.00 644.20 58.00 28371.20 2595.20 88.20 42.56 61.57 64.59 28.00 1.42 99.96I attached a picture from vmware disk performance. This morning queue did not increased too much.
-
Hello! It looks like you're interested in this conversation, but you don't have an account yet.
Getting fed up of having to scroll through the same posts each visit? When you register for an account, you'll always come back to exactly where you were before, and choose to be notified of new replies (either via email, or push notification). You'll also be able to save bookmarks and upvote posts to show your appreciation to other community members.
With your input, this post could be even better 💗
Register Login