
graphs on stack
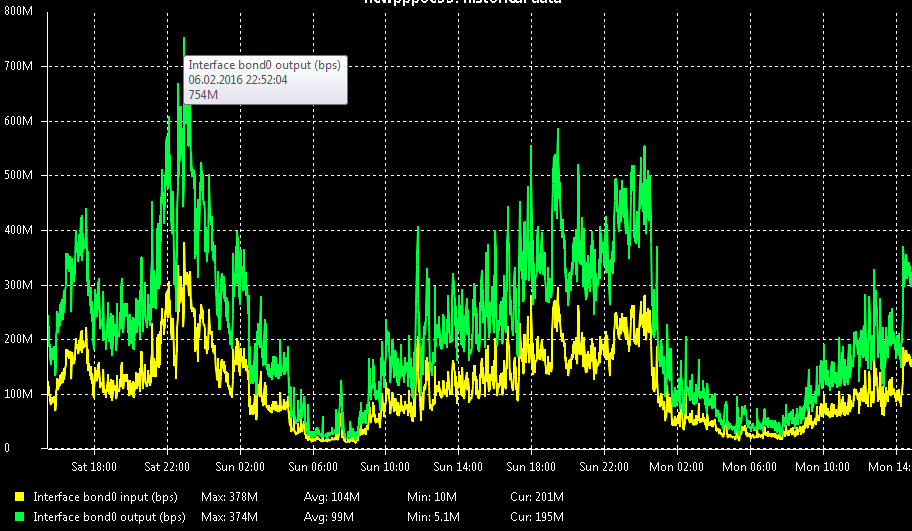
-
-
The legend shows each DCI separately.
So the legend correctly states avg. for each DCI.If you stack the graphs, on the graph itself, you will of course see totaled (stacked) result.
For area and gradient, its all in the graph properties.
You can watch this video, it covers almost all graphing options available in NetXMS:
https://youtu.be/iIAAIUp9Wd0 -
@tomaskir said in graphs on stack:
The legend shows each DCI separately.
So the legend correctly states avg. for each DCI.If you stack the graphs, on the graph itself, you will of course see totaled (stacked) result.
For area and gradient, its all in the graph properties.
You can watch this video, it covers almost all graphing options available in NetXMS:
https://youtu.be/iIAAIUp9Wd0You're talking about the predefined graphs, I mean, right-click mouse DCI - Line chart. - How can we make the gradient or the area?
Yes, graph in stack mode, i understood 378+374=752 - on graph this is 754 almost identical. But why do I see the value of it to the inbound interface, if it is the total?
Hello! It looks like you're interested in this conversation, but you don't have an account yet.
Getting fed up of having to scroll through the same posts each visit? When you register for an account, you'll always come back to exactly where you were before, and choose to be notified of new replies (either via email, or push notification). You'll also be able to save bookmarks and upvote posts to show your appreciation to other community members.
With your input, this post could be even better 💗
Register Login