
X-Axis legend (time) doesn't exist when looking at over 12 hours on graph
-
Hello,
I started using NetXMS recently to replace The Dude and Cacti. What I really liked about Cacti is the graphing function, zooming in and out, selecting points of data and seeing the graph based on the selected area.
I have 2 questions: 1)Is the described function available, and if so, how do I find it?
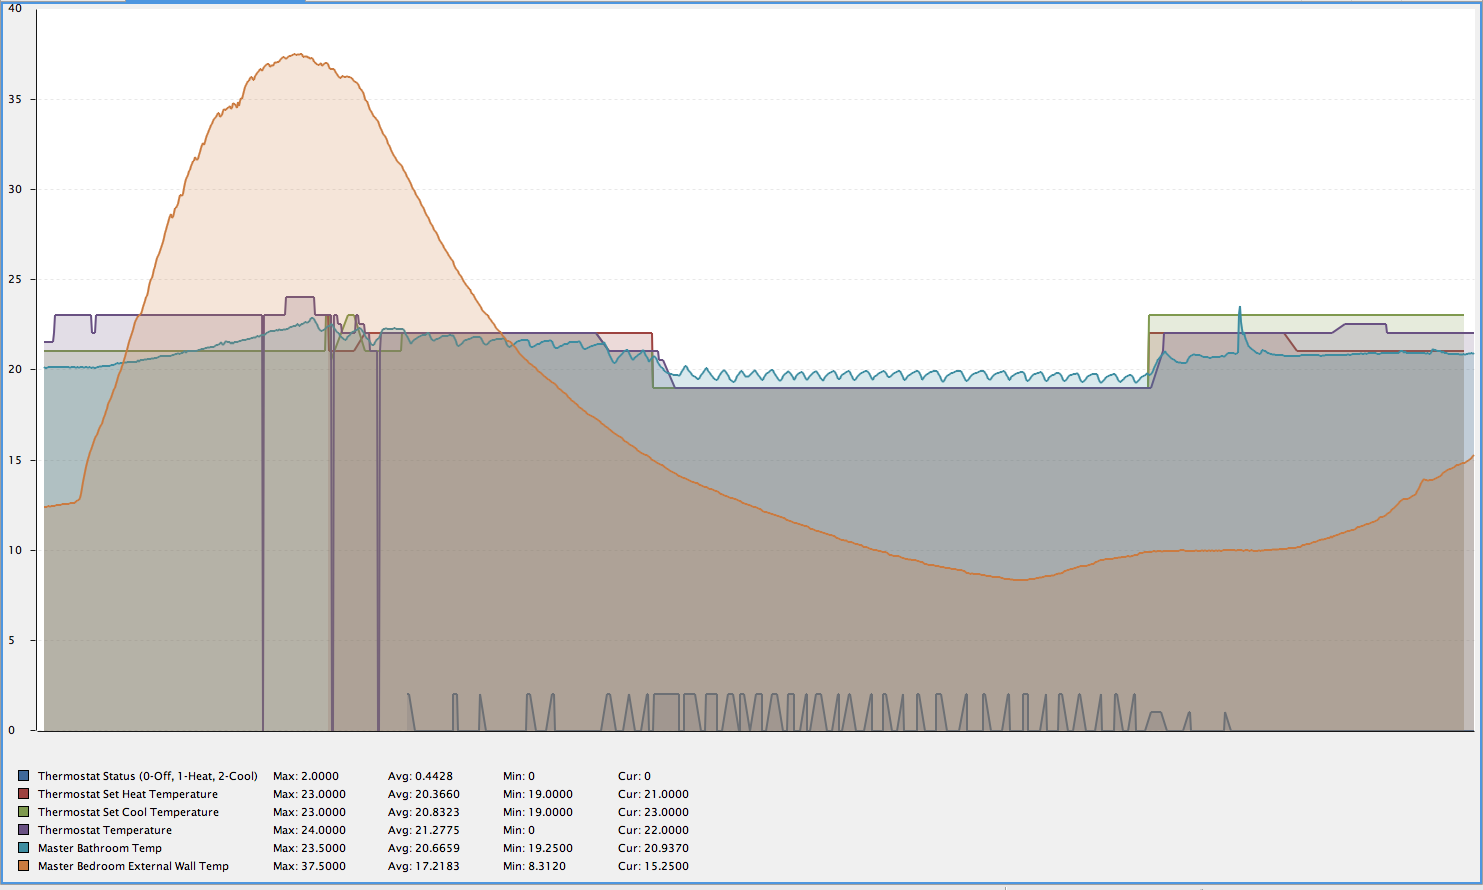
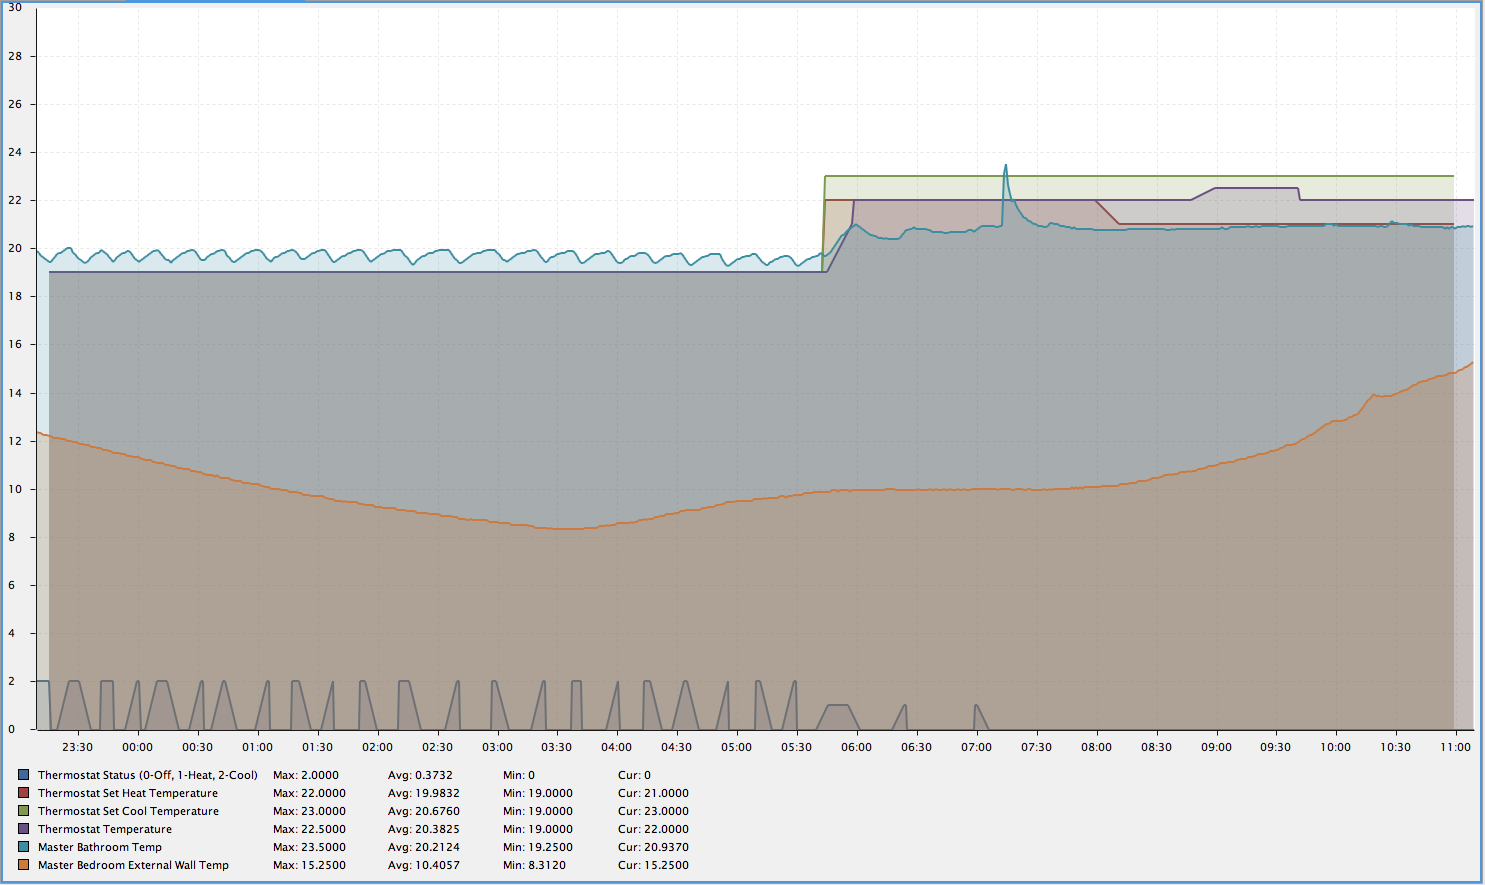
2) If you look at the attached graphs, you can see that anything under 13 hours I can clearly see the time (11.09.12), when I select the "Last Day" preset, the dates/times have disappeared from the X-axis (11.09.28). I have tried with both browser (Safari) and the Mac version of NXMC (version 2.0.6) running on CentOS7.Thank you for your assistance.
-
Hi,
-
currently no;
-
it is known issue that should be solved in 2.1 (and possibly in 2.0.7).
Best regards,
Victor -
-
-
Bug fixed. Will be included in new stable release.
-
Hello! It looks like you're interested in this conversation, but you don't have an account yet.
Getting fed up of having to scroll through the same posts each visit? When you register for an account, you'll always come back to exactly where you were before, and choose to be notified of new replies (either via email, or push notification). You'll also be able to save bookmarks and upvote posts to show your appreciation to other community members.
With your input, this post could be even better 💗
Register Login