
Templates and Performance graphs with multiple DCIs
-
-
Good to know. You mean a snapshot of source, from here:

Download NetXMS 7.0.3
Server, agent, desktop and web client, tools and source code for every supported platform, with checksums and GPG signatures.

NetXMS (www.netxms.org)
right? I'll make sure to upgrade before we push to a production server. Thanks for the info!
-
No, I mean from here http://git.netxms.org/public/netxms.git?js=1
I am running both the client and the server from newest commits in develop.Please be aware these are development builds, and may contain bugs and/or issues.
I would recommend running only release versions in production, unless you are prepared to deal with all that comes with running latest development builds in production.That said, nothing was really touched in DCIs and Perf. tab since 2.0.3 release (atleast not that I remember), so your issue is probably somewhere else.
-
Ah, I found out my problem. It's for DCI's that are using instancing. That's a bit different I would bet. What I mean is, I'm able to have (say) a graph with in/out bits/second by using two instanced DCI's that fetch those numbers from every interface. However, if I put those DCI's on a template, I get that earlier invalid DCI ID error when I open it up on a node's data configuration.
You were right about the regular graphs, though. I'm not sure what was wrong with that last attempt, but I got templated DCI's on the same performance graph, with my version, which is definitely nice.
Are you able to graph with instanced DCI's? Or should I log a bug report and move on?
Thanks,
Zach -
I think this is likely directly related to my post here: https://www.netxms.org/forum/configuration/instance-discovery-performance-tab-and-attached-dcis/
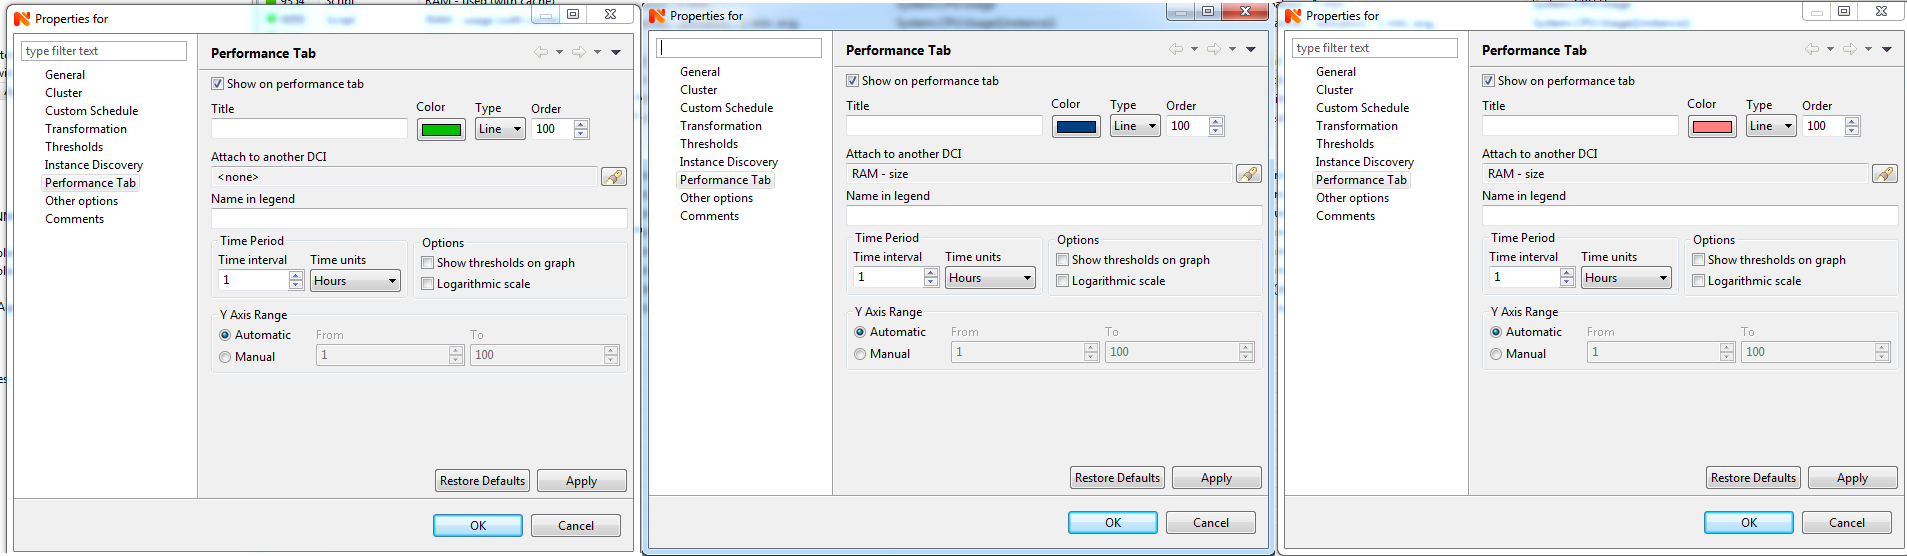
If you have two DCIs created from instance discovery, make sure that the first one created by instance discovery is the "primary", i.e. not attached to anything else.
The other DCI which is created afterwards can then attach to said "primary" and it should all work.
The order of your DCIs for this is important.Cheers
-
-
I'm trying to set this up now. I have interfaces setup in my template to pull the traffic from all the interfaces (bits/sec). I have the DCIs getting created properly and showing proper last values in nodes that have the template bound to them.
However, I can't seem to get a graph working for these. Is anyone able to explain to me how to set up the performance tab to get a combined graph of these values.
The best I've been able to do is get one graph per interface DCI which creates a bunch of graphs and it's not that helpful.
-
Hi,
assuming you are using version 2.1.x you can put proper group name in DCI configuration. You can use macro {instance} there, so for example you can set group name for both Tx and Rx DCI as IfTraffic_{instance} - then server will create unique group name for each Tx/Rx DCI pair, and you'll have one graph per interface.
Best regards,
Victor -
Thanks Victor. I have it working now. I am a little confused by the macro substitutions though. In the General section for description I have {instance-name} to put the interface name into the description column when looking at last values. For the parameter I have {instance} at the end of the oid to be able to grab the data from SNMP.
Just now when I tried your suggestion on the performance tab, {instance} works to pull the same value as {instance-name} does on the general tab, but {instance-name} didn't substitute anything.
Are the substitutions tab specific, or is there some rules for this that I am not understanding?
Also, is there anyway to filter out the unconnected interfaces on the performance tab? I don't want to filter them out of the node entirely as it would be good to know if something is plugged into a port it shouldn't be, but I don't want to see the traffic graphs for interfaces which don't have any if I can avoid it.
Thanks again.
-
{instance-name} substitution is not implemented for group field (which I agree is counter-intuitive). We just need to clean it up a bit and make sure that both macros are substituted.
Currently there is no instance filtering for performance tabs.Best regards,
Victor -
A few things I think would be really nice to have in the template
- Filtering on the performance tab
- A way to order the graphs on the tab
- The invert values option in the performance tab. I'd like to be able to do the TX/RX as positive and negative values.
And having some consistency in the macros would be great. It feels kind of like whack a mole trying to configure things to match up what we have on our other nms right now. I think we will be able to get all the functionality we need and then some, but it's a bit of a steep curve getting to speed.
Thanks again for the help.
-
Hi,
regarding #2 - there is "order" option. Graphs with lower value will go up.
Best regards,
Victor -
Hello! It looks like you're interested in this conversation, but you don't have an account yet.
Getting fed up of having to scroll through the same posts each visit? When you register for an account, you'll always come back to exactly where you were before, and choose to be notified of new replies (either via email, or push notification). You'll also be able to save bookmarks and upvote posts to show your appreciation to other community members.
With your input, this post could be even better 💗
Register Login