
NetXMS grinds to a crawl - Event Processing effectively stops
-
No transforming - straight from the Performance tab - NetXMS template standard monitors.
NetXMS server: events processed for last minuteAs for capacity to process - when we restart we rip through the backlog in a minute which, for a backlog of 300k equates to about 3-5,000 per second.
I think that in reality, we quite possibly really are only processing about 300 "events" per minute - not very much at all.
We do get a large number of traps that I have set not to write to event log and hence no "event processing" - might look to see if anything their.
DISK I/O queue is average of 0.5 apart from when the 10 minutes when the backup runs - spikes out to 15 for a minute or so. Sits on FLASH storage so expect this to be fast.
CPU - plenty of cores and also plenty of memory - now. I noticed the "physical memory used by process" had a steady climb - I assume it was the every growing Node count. Deleted my 3000 duplicate nodes and got 1GB back - had added 4GB just to be safe - will watch to see how this goes.
Not in huge hurry to reproduce this - just really strange that it happens.
The really annoying part is that as Event Processor queue is not a performance DCI, I cannot track this issue any better.
On a huge plus side - if you are able to process 220 events per second and I am doing about 300 per minute, I clearly have capacity to "lean" on NetXMS more. I have ORION in my sights and my only concern (apart from the grind) was capacity.
I think that the 4GB extra ram, the 2 extra cores and the deletion of my duplicate Nodes has probably pushed this issue down so it is not triggering like it was. Will keep an eye on this though - and would really like to see Event Processor Queue as a Template item - NetXMS critically depends upon this - so instrument it - please!!
-
-
Hi,
did you check what events were processed during spike? That can gave an idea where to look. Also, do you have filter scripts in your event processing policy?
Best regards,
Victor -
Went to 2.2.16 as my primary work around.
No filtering scripts but all policies had the default "stop processing" unticked.
I still seem to have a CPU usage increase around 10:00 each day - but now with my 4000 duplicate nodes deleted plus "stop processing" ticked, do not seem to be being impacted.
I know how to probably check (now I have a few minutes to think about it) - open up the alarms with create time when I think problem starts and compare to event time - they are normally the same so any difference indicates Event Processor is lagging.
Will look a bit closer and see if anything stands out.
-
Well - 2.2.16 did not fix it

Did some load testing and was seeing a consistent 2,000 messages queued which meant a 5 minute delay between event time and Alarm creation time.
Whilst looking tonight, some clown pulled a mgmt interface and triggered a total of 5,000 events over 5 minutes - blowing my Event = Alarm time out again.
As it turns out, 2,500 of them are CISCO MAC Move events .1.3.6.1.4.1.9.9.215.1.3.3.0. - which I do not care about - AT ALL!!
What is my best option for this specific event to unburden event processing?
a) Delete the SNMP trap configuration so it does not become an event and takes away half the load of Event Processor.
b) Leave the configuration, but set the Event Processing Policy to "Do not change alarms" and "Stop Processing"
c) some other option.Other than the above, what else can anyone suggest I do to speed up Event Processing?
FYI - We are up at 152 EPP's now and growing.
-
-
Thanks for the pointer - extremely appreciated

Sadly (for me) this appears to be correct - I need to disable these at Switch level. If I delete the SNMP_TRAP_PROCESSOR for these NetXMS will treat this as unmapped trap and process it anyway - as an unmapped trap event. Sometimes, you just cannot win
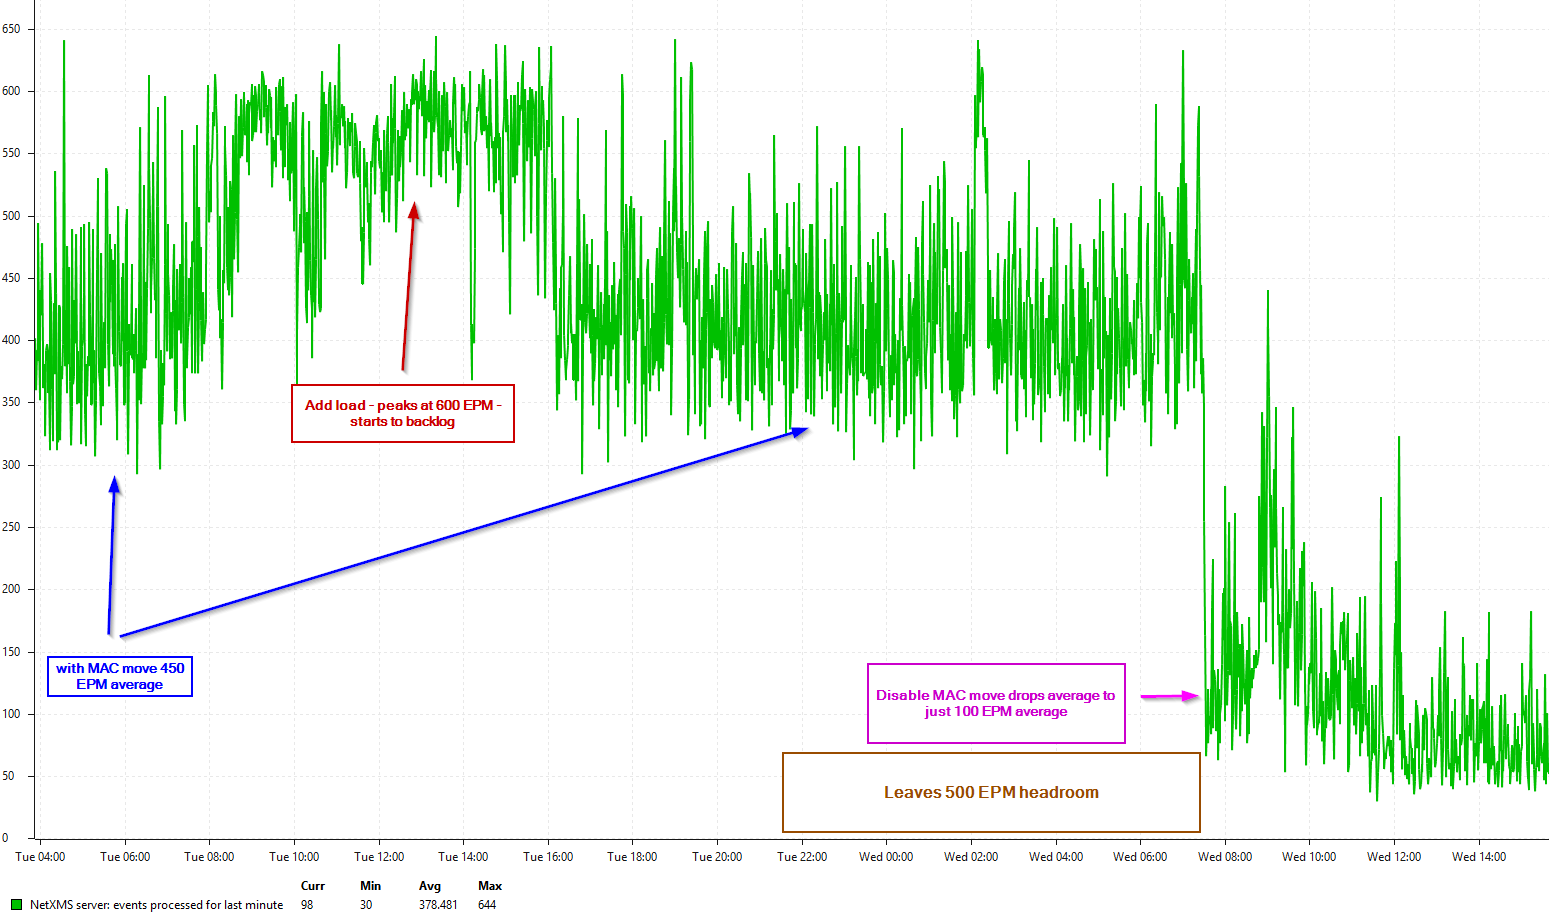
24,000 traps in last hour - 83% MAC moves.
Command Default
The sending of SNMP MAC notification traps is disabled.no snmp-server enable traps mac-notification [ change] [ move] [ threshold]
Will see if my Network Admins will let me suppress these - if not - they can have these traps in their NMS - which, ironically they do NOT have.
Does not fix my underlying woeful performance problem - but does provide a significant lightening on the load.
-
When it gets behind, I can see a consistent 300 - 350 events per minute being processed instead of the 150-250 range it is able to handle. I can put a threshold alert on this!!
Today it got up to 113,000 events behind and had been getting behind since 23:00 last night - 21 hours of incorrect alert times. Still cannot alert on this though.
At bounce time, Event time ==Alert time was 4.5 hour difference.
Getting rid of those MAC move alerts would eliminate this problem (300k per day reduction in events)
The reporting that Events Processed in last minute of 2 Billion I think is not true - shutdown and restart looks like it just treats all queued as actioned - and clears that backlog.
It means that on restart, I lost four and a half hours of events potentially being potential alarms - which I will never know
Really would like to know why our NetXMS seems only capable of about 350 events per minute.
I suspect PostgreSQL standard/default install settings likely factor as there is nothing more at a NetXMS level I can alter to improve NetXMS.
Updated as per post in Config - did not help - possibly even worse!! Event processing started to climb on restart - getting worse and worse.
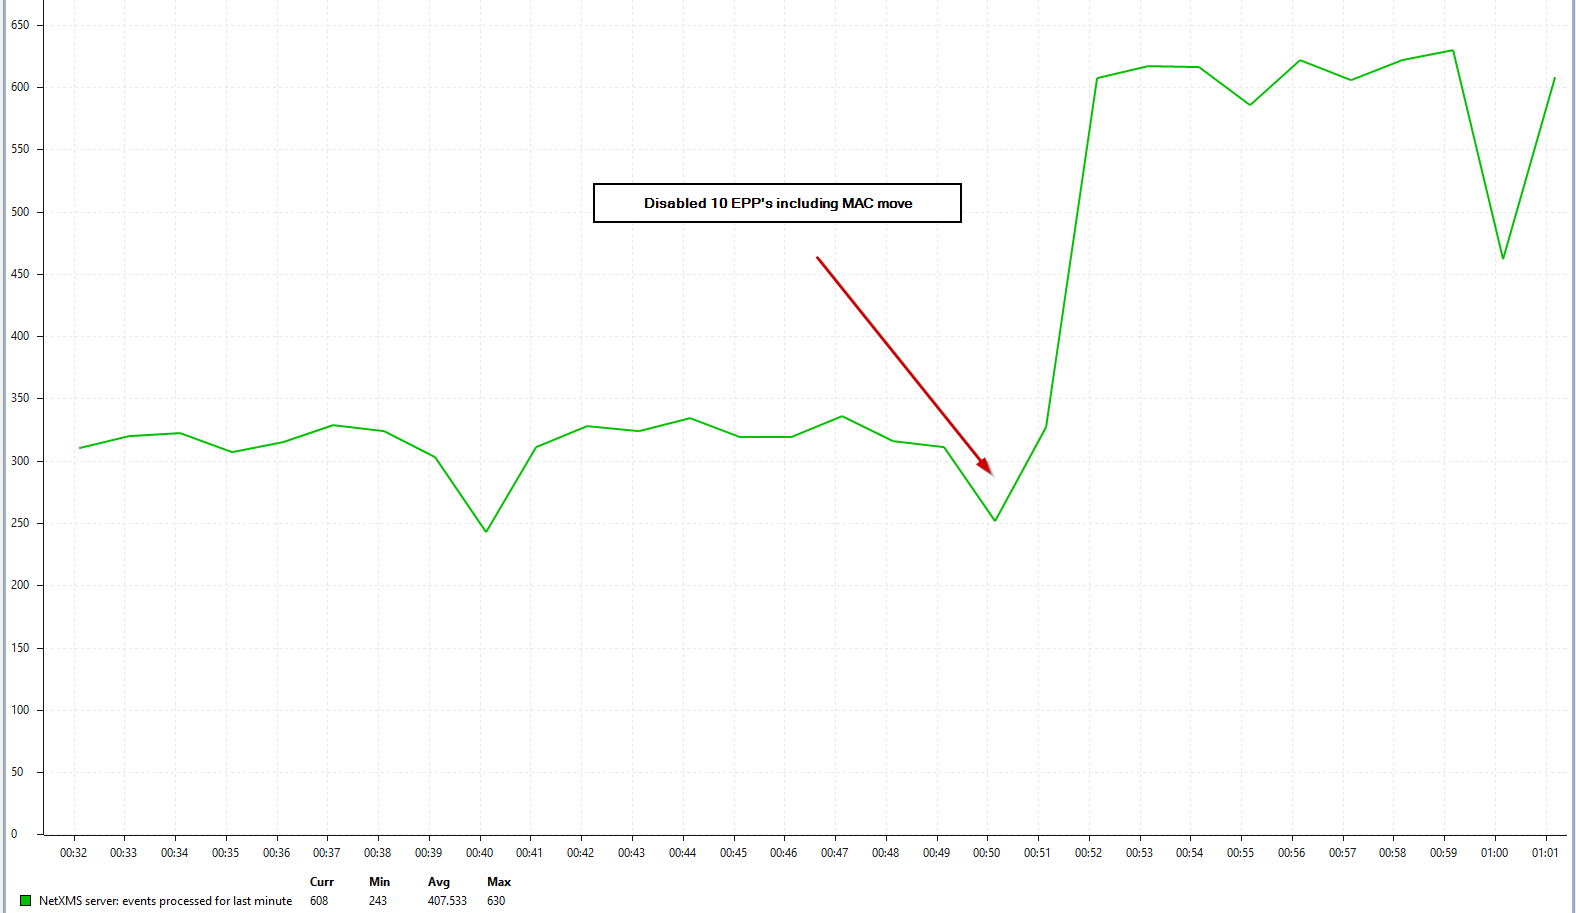
The EPP's that yesterday I had changed from Disabled to Enabled - Do not change alarms - definitely made it worse. Changed back to disabled and Event Processor queue coming back down - slowly - but at least it is coming back down. Interestingly - Events processed in last minute is now nearly double since disabled.
-
The following won't help with your performance issue, but should explain the 2 billion events.
The 2 billion events would be the total number of events resetting to 0. In version 3 you can open the raw dci value graph to confirm that. So it would basically be the value of all events that the system had processed since last startup.
I see that with a few counters like that. In version 2 I used to add some code to just drop values that seem crazy high. In version 3 I'm wondering if I can use the raw dci data to detect a decrease in value, at which point I'd simply replace the current simple delta with the current raw dci value (as going down on a total value counter should only happen on a reset to 0). Similar with average delta per minute, except I'd need to take the timestamp into account as well. -
Having such huge values which are not an accurate reflection throws out completely the ability to use the data. Given that the "events" are not being truly processed, probably more like a bug.
Would be nice to have some of these things ti be able to set as an exception, or have them report properly in the first place.
As for performance - headache continues
- more performance testing today, hitting our newer 600 EPM and backlog occurring. Good news though, having managed to get to 600 EPM through the Postgres settings, plus some EPP disabling, we caught up rather than triggering a bounce.I have since disabled more EPP - down to 100 active - I can get the disabled events from Event log if I really need them. Not an ideal situation - but what options do I have - EVERYTHING else has been tried
On a positive note - my Network guys have agreed to stop the MAC move traps. On a negative note - they said they had done it - but traps keep coming. Will get that sorted tomorrow.
Holistically speaking, Event Processor Queue needs to be a DCI item as being behind can be a calamity if a mission critical alarm was to be delayed by an hour. Faith in NetXMS is either there or it is not. If e cannot rely on alarms showing when the event comes in - what is the point of NetXMS? If we cannot even monitor when this is happening - how can we have faith?
I have an exception set for Events Processed in last minute of > 500 for last 4 polls; indicating NetXMS "might" be under stress. Having a monitor for Event Processor Queue > 1,000 would be much, much, much better.
Even nicer would be the capacity to process 1,000 events per minute AND have 200 EPP's.
My friendly Network guys made their change - what a difference it made!! Fixes my immediate problem - but NetXMS still needs better way of reporting when Event Processing starts banking up.
Hello! It looks like you're interested in this conversation, but you don't have an account yet.
Getting fed up of having to scroll through the same posts each visit? When you register for an account, you'll always come back to exactly where you were before, and choose to be notified of new replies (either via email, or push notification). You'll also be able to save bookmarks and upvote posts to show your appreciation to other community members.
With your input, this post could be even better 💗
Register Login