Skip to content
  • Categories
  • Recent
  • Tags
  • Popular
  • Users
  • Groups
Skins
  • Light
  • Brite
  • Cerulean
  • Cosmo
  • Flatly
  • Journal
  • Litera
  • Lumen
  • Lux
  • Materia
  • Minty
  • Morph
  • Pulse
  • Sandstone
  • Simplex
  • Sketchy
  • Spacelab
  • United
  • Yeti
  • Zephyr
  • Dark
  • Cyborg
  • Darkly
  • Quartz
  • Slate
  • Solar
  • Superhero
  • Vapor

  • Default (Flatly)
  • No Skin
Collapse
Brand Logo

NetXMS Forum

  1. Home
  2. Support
  3. Dashboards and templates

Dashboards and templates

Scheduled Pinned Locked Moved Support
7 Posts 3 Posters 62.7k Views
  • Oldest to Newest
  • Newest to Oldest
  • Most Votes
Reply
  • Reply as topic
Log in to reply
This topic has been deleted. Only users with topic management privileges can see it.
  • S
    S
    stam76
    wrote on last edited by
    #1

    Hi,

    I have not installed NetXMS yet but I am looking for a replacement to our current solution, however, would I be correct in thinking that I need to first create custom dashboards for everything?  Are there any templates that we could use to make it quicker?

    Thanks

    Stam

    1 Reply Last reply
    0
    • F
      F
      Filipp Sudanov
      wrote on last edited by
      #2

      A dashboard is typically something that displays data about some business-critical things - e.g. condition of all web servers, etc. So generally there are not many dashboards and it's hard to automate their creation, so yes, dashboards are created manyally (also some tweaks are possible, e.g. export dashboard's .xml, modifying it and importing back).

      But dashboards are not the only way to see data in NetXMS. You can open last values for any node, you set up summary tables - in that a table with multiple predefined columns is displays for all nodes added to a specific container (that's folder of nodes, one node can be present in multiple containers). From last values you can easily open graph and history for each metric. And there's performance tab that allows to display graphs for one node - it's configuration is coming from templates, so e.g. for web servers you could have additional template that's collecting nginx metrics, these metrics could have checkbox "display in performance tab".
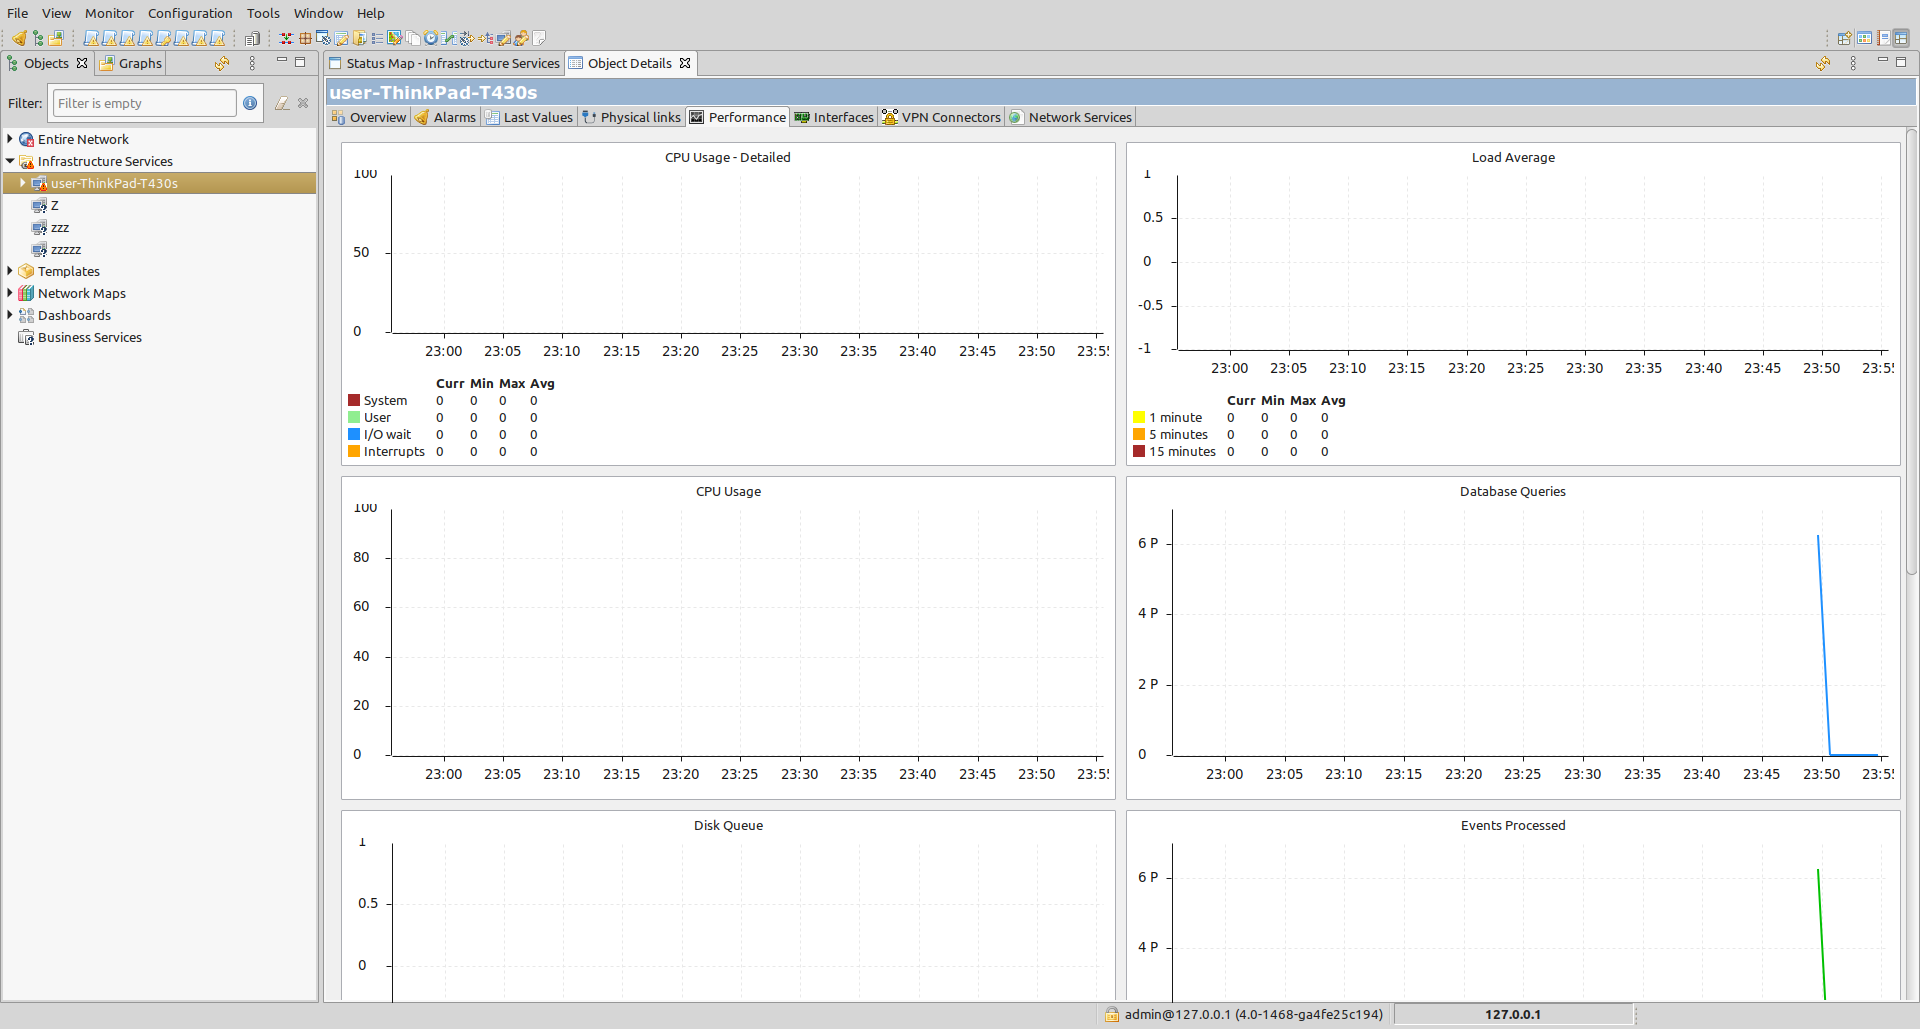

      Screenshot at 2021-09-16 23-55-45.png

      1 Reply Last reply
      0
      • S
        S
        stam76
        wrote on last edited by
        #3

        But a majority of other monitoring systems have default dashboards which can be amended.  Starting from scratch and essentially copying the format of other NMS, seems to be a lot of work and effort. Unless I am mistaken about something?  😮

        1 Reply Last reply
        0
        • F
          F
          Filipp Sudanov
          wrote on last edited by
          #4

          Can you give some details on what do you expect on these dashboards / what are the dashboards on these NMSes? Are they per-node dashboards, or they are system-wide dashboards? Do they show some data for all nodes?

          1 Reply Last reply
          0
          • A
            A
            AleCoelli
            wrote on last edited by
            #5

            Hi Filipp..
              both performace tab and dashboards lack in one point: we need to easly change the shown timeperiod of the graphs and all the timeperiods of that performance tab/dashboard should be sinconized.
            I also think that could be an idea to give an option to generate a custom dashboard from a performance tab: it could be used as base for dashboard customizations.

            Thanks
            Alessandro

            1 Reply Last reply
            0
            • A
              A
              AleCoelli
              wrote on last edited by
              #6

              last thing [for today  ;D 😎 ]
              Double scale graph are a must have for ICMP monitoring:

              RED for packet loss, linked to right y axes, GREEN for response time, linked to te left y axes

              Thanks
              Alessandro

              1 Reply Last reply
              0
              • F
                F
                Filipp Sudanov
                wrote on last edited by
                #7

                Hi!

                I've added a couple of issues for these features:
                https://track.radensolutions.com/issue/NX-2248
                https://track.radensolutions.com/issue/NX-2249

                NX-2249 is probably lower in priority, but might be done at some point.
                Dashboard generation from performance tab is technically possible, but there's a lot of higher-priority things.

                1 Reply Last reply
                0

                Hello! It looks like you're interested in this conversation, but you don't have an account yet.

                Getting fed up of having to scroll through the same posts each visit? When you register for an account, you'll always come back to exactly where you were before, and choose to be notified of new replies (either via email, or push notification). You'll also be able to save bookmarks and upvote posts to show your appreciation to other community members.

                With your input, this post could be even better 💗

                Register Login
                Reply
                • Reply as topic
                Log in to reply
                • Oldest to Newest
                • Newest to Oldest
                • Most Votes


                • Login

                • Don't have an account? Register

                • Login or register to search.
                Powered by NodeBB Contributors
                • First post
                  Last post
                0
                • Categories
                • Recent
                • Tags
                • Popular
                • Users
                • Groups