
Powerless to edit the "Availability Chart" in Dashboard menu after 3.9 > 4.1
-
Hey,
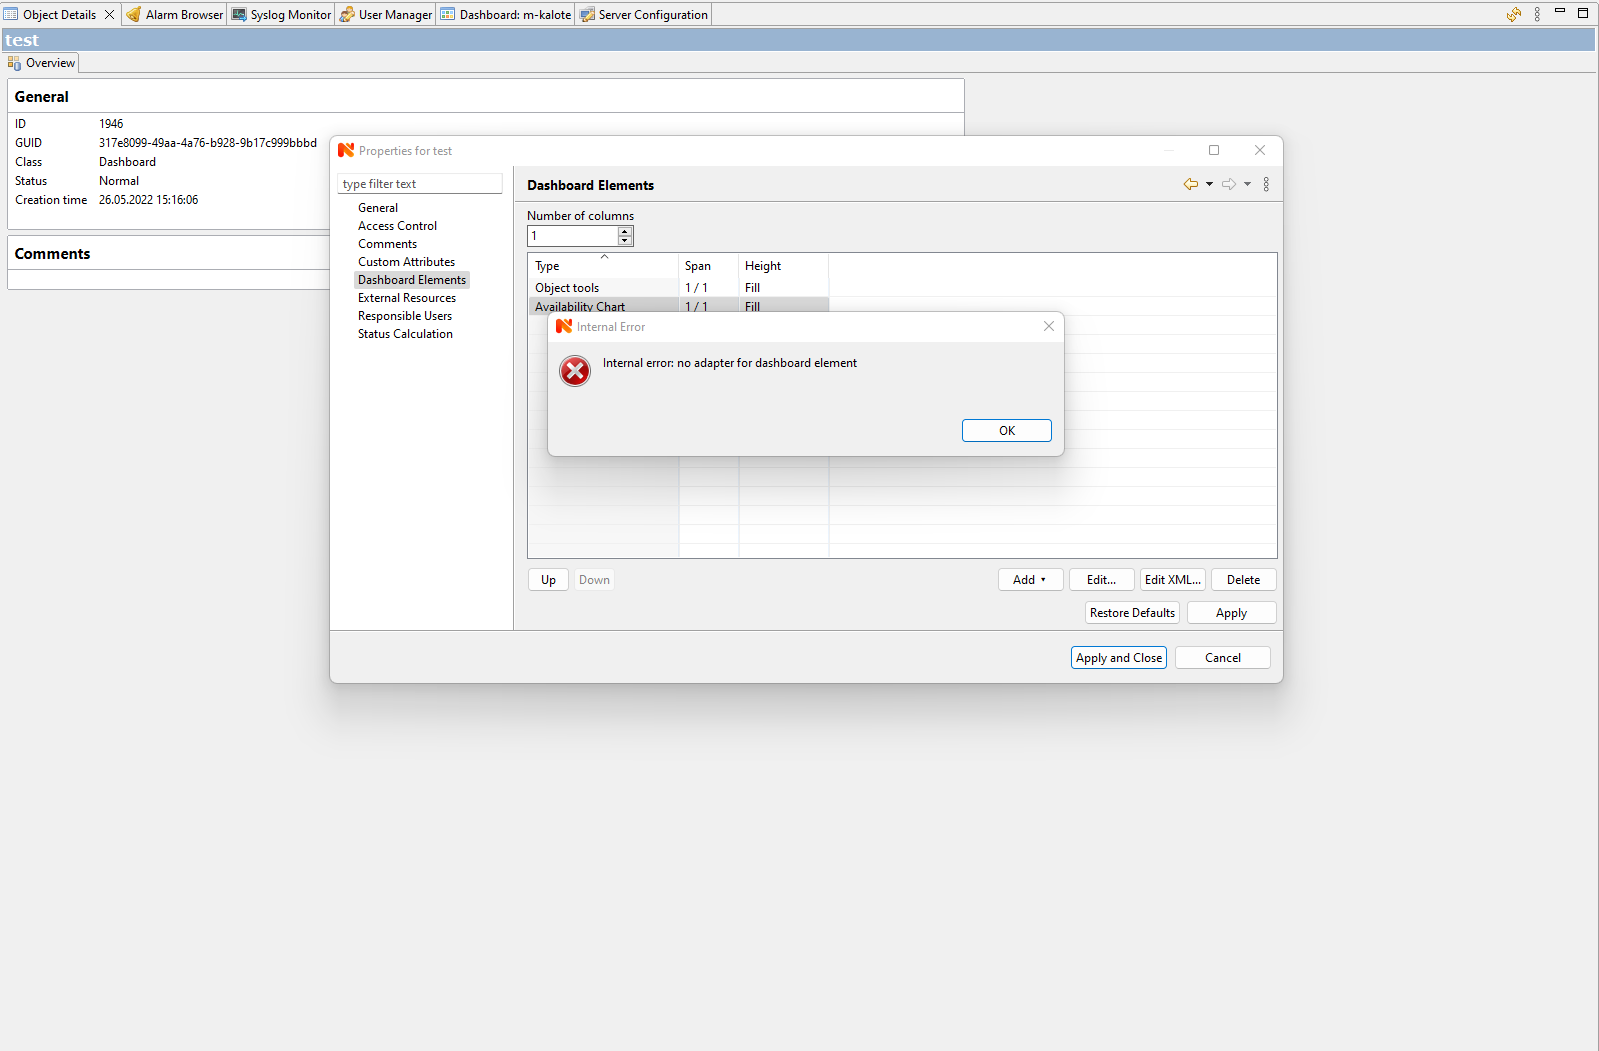
After the upgrade from 3.9 to 4.1 unable to edit/add business services to the Availability Chart. "Dashboard" menu on the left side > right button click "Properties" > scroll down to "Dashboard Elements" > click "Add" > choose the "Availability Chart" > push "Edit" button > Vuola! getting the notification: "Internal error: no adapter for dashboard element". By itself, Business Services is working fine. Please help with what kind of adapter and where it needs to add.
Also, previously the Business services node operation value was displayed ("Business Services" > select the node > "Overview" section > "General" subsection) in % of uptime per day, month etc. However, after the upgrade, there are left "Service state=OPERATIONAL". How to add % of uptime per day, month etc.?
Ubuntu 20.4/ NetXMS 4.1
-
Business services were totally reworked in 4.0 with a lot of new options - it's now possible to automatically populate them and add checks, etc.
Looks like dashboard element was totally forgotten during the rework.
I will check with developers about this and availability percentages. -
Thank you Filipp! Please reply ASAP if you get any feedback from developers.
-
-
Yes, we aware of it and will fix soon.
Best regards,
Victor -
This was just fixed, will be available in 4.3.1 when it will be released.
Hello! It looks like you're interested in this conversation, but you don't have an account yet.
Getting fed up of having to scroll through the same posts each visit? When you register for an account, you'll always come back to exactly where you were before, and choose to be notified of new replies (either via email, or push notification). You'll also be able to save bookmarks and upvote posts to show your appreciation to other community members.
With your input, this post could be even better 💗
Register Login