
SNMP communication issues
-
what you mean by "getting a graph on some of the interfaces"?
can you query .1.3.6.1.2.1.2 on the routers where interfaces are not reported?
-
-
-
.1.3.6.1.2.1.2 is a base OID for IF-MIB.
something like "nxsnmpwalk IP 1.3.6.1.2.1.2.2.1.2" should fetch list of interfaces.
-
-
nxsnmpwalk that Alex mentioned is a command-line tool included with NetXMS. On linux it should be available in PATH, on Windows it's in C:\NetXMS\bin
-
-
That's the whole command. Replace "IP" with actual IP of the router in question.
C:\NetXMS\bin\nxsnmpwalk IP 1.3.6.1.2.1.2.2.1.2 -
-
-
@nichky said in SNMP communication issues:
this is what im gettign
C:\NetXMS\bin>nxsnmpwalk IP 1.3.6.1.2.1.2.2.1.2
Unable to create UDP transport: Invalid hostname or IP addressReplace "IP" with actual IP of the router in question.
-
Hi Alex,
sorry my bad, that works , i check the stats of that.
but we have options that we can run netxms on MikroTik container?
ive been folowing:
https://github.com/alkk/netxms-agent-mikrotikThe conteiner is runnign , but cant log in to it
-
-
@nichky said in SNMP communication issues:
but we have options that we can run netxms on MikroTik container?
yes, you can run agent on the mikrotiks. normally, it's enough to collect information via SNMP. Agent is mostly used for running zone proxies (e.g. with network behind NATs). Full instructions are on the GitHub page.
-
@nichky said in SNMP communication issues:
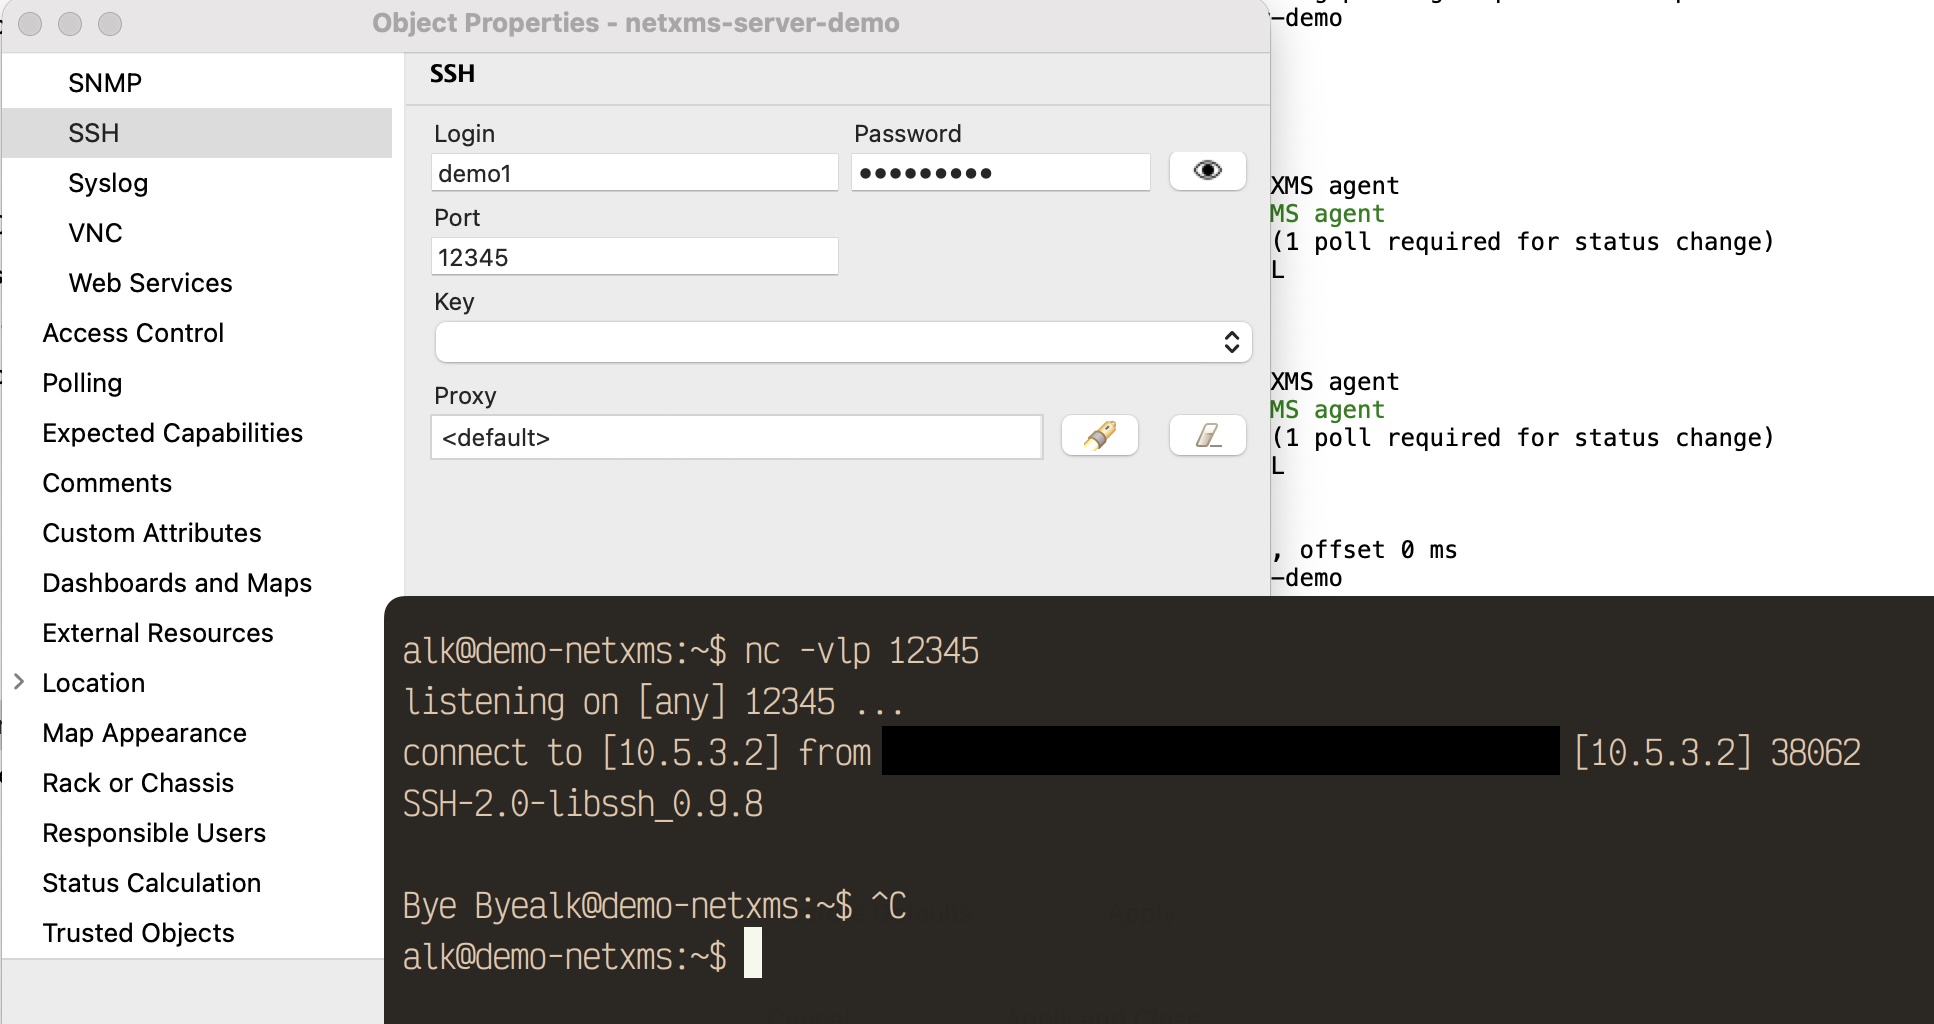
pls, how to fix the the accessing to ssh from NetXMS?
check that:
- you saved and applied properties before test
- you are running latest version of the system.
I've just checked, and custom port works just fine.
-
-
what do you mean "can't login"? it's an agent, not a server.
-
-
@nichky said in SNMP communication issues:
Thansk Alex
so this is i'm expecting.
Since the container is running i should be able to log in to netxms (similar to how i'm doing on windows) via web using ip:8080 , ip:4700 or ip:4701You are mixing up monitoring server, web, and agent.
Monitoring server (netxmsd, "NetXMS Core" service) listens on port 4701, you connect there using desktop client.
Server do all the scheduling, data collection, and processing. Collection can be done via multiple procorols - SNMP, native agent, SSH, etc.WebUI - expose :8080/:8443, you connect there with the browser. WebUI transparently connects to the monitoring server.
Agents listen on port 4700 (they can go in reverse as well). Server connects to the agents to collect data / perform tasks.
So no, you do not connect to the agent with the browser. You could register it in the monitoring instead, and configure metrics you want to monitor.
-
Hello! It looks like you're interested in this conversation, but you don't have an account yet.
Getting fed up of having to scroll through the same posts each visit? When you register for an account, you'll always come back to exactly where you were before, and choose to be notified of new replies (either via email, or push notification). You'll also be able to save bookmarks and upvote posts to show your appreciation to other community members.
With your input, this post could be even better 💗
Register Login