Skip to content
  • Categories
  • Recent
  • Tags
  • Popular
  • Users
  • Groups
Skins
  • Light
  • Brite
  • Cerulean
  • Cosmo
  • Flatly
  • Journal
  • Litera
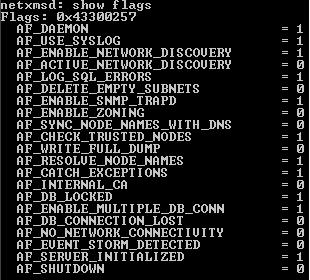
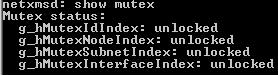
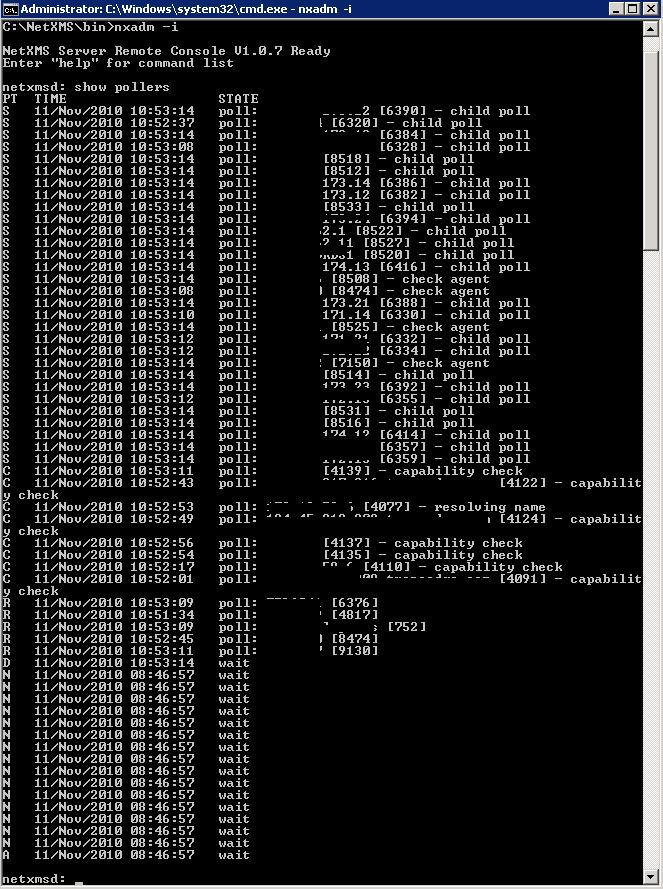
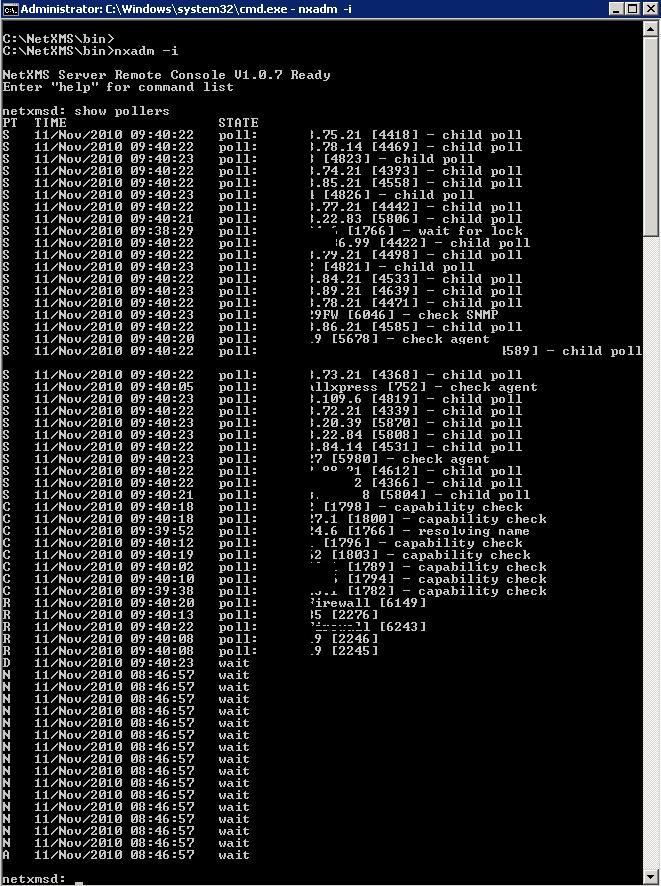
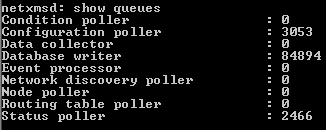
  • Lumen
  • Lux
  • Materia
  • Minty
  • Morph
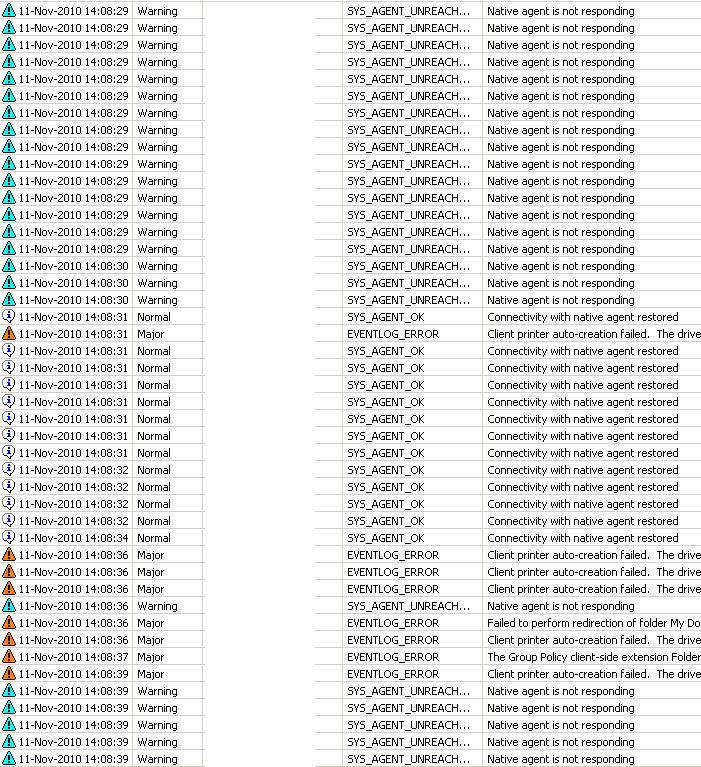
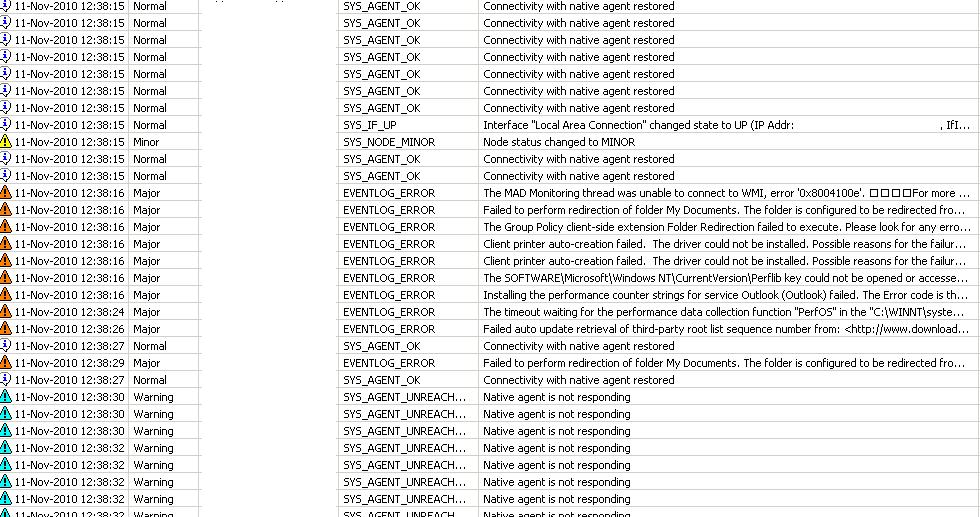
  • Pulse
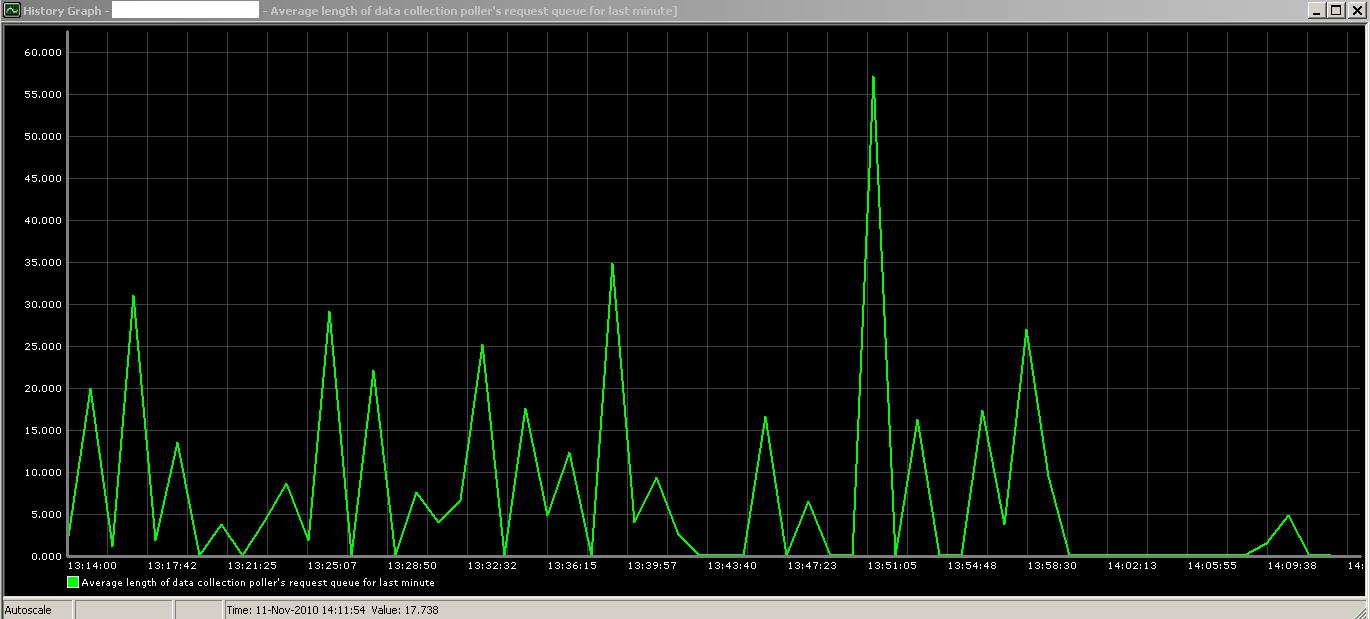
  • Sandstone
  • Simplex
  • Sketchy
  • Spacelab
  • United
  • Yeti
  • Zephyr
  • Dark
  • Cyborg
  • Darkly
  • Quartz
  • Slate
  • Solar
  • Superhero
  • Vapor

  • Default (Flatly)
  • No Skin
Collapse
Brand Logo

NetXMS Forum

  1. Home
  2. Support
  3. NetXMS Server Crashing

NetXMS Server Crashing

Scheduled Pinned Locked Moved Support
39 Posts 3 Posters 153.2k Views
  • Oldest to Newest
  • Newest to Oldest
  • Most Votes
Reply
  • Reply as topic
Log in to reply
This topic has been deleted. Only users with topic management privileges can see it.
  • V
    V
    Victor Kirhenshtein
    wrote on last edited by
    #8

    Could you please try to put attached msvcrt.dll into NetXMS bin directory and restart server?

    Best regards,
    Victor


    msvcrt.dll

    1 Reply Last reply
    0
    • V
      V
      Victor Kirhenshtein
      wrote on last edited by
      #9

      Sorry, looks like this will not help, because modern Windows version ignores local copy of msvcrt.dll and always use one from system directory because it's in a list of "known DLL". I suspect that there could be incompatibility with new versions of msvcrt.dll, because netxmsd.exe built with VC6. I'll try to do special build this evening.

      Best regards,
      Victor

      1 Reply Last reply
      0
      • N
        N
        Netvoid
        wrote on last edited by
        #10

        Victor,

        First, thank you very much for all this support. I would be happy to find a way to donate, or, is Raden Solutions a direct connection to you folks? I am completely open to changing my OS from Win2008 R2 64bit to anything you suggest for better outcomes. Although I am also happy to continue helping us both resolve this issue.

        Just let me know.

        Regards,

        1 Reply Last reply
        0
        • V
          V
          Victor Kirhenshtein
          wrote on last edited by
          #11

          Thank you! I hope that we will be able to finally solve this issue without forcing you to switch to another OS.
          Donations are welcome in any form 🙂 In fact, even your patience with this strange issue resolution is very helpful - because we are unable to reproduce this issue at our systems. And yes, Raden Solutions is owned by me and Alex.

          Attaches is another build of libnetxms. Could you try to run server with it?

          Best regards,
          Victor


          libnetxms.zip

          1 Reply Last reply
          0
          • N
            N
            Netvoid
            wrote on last edited by
            #12

            Victor,

            Replaced these files in the bin folder but had no luck because the service wouldn't start. I reboot just in case and still no luck service wouldn't start. I restored the files and system was able to come up again.

            Regards,

            Clark

            1 Reply Last reply
            0
            • V
              V
              Victor Kirhenshtein
              wrote on last edited by
              #13

              I create full build with changed memory management. Installer available at https://www.netxms.org/download/rc/netxms-1.0.8-rc1.exe. It can be installed as usual, and replaced back to 1.0.7 if needed.

              Best regards,
              Victor

              1 Reply Last reply
              0
              • N
                N
                Netvoid
                wrote on last edited by
                #14

                Yeah I tried this one and it failed to start properly also. Agent and core on the server give similar error upon startup attempts.
                 

                1 Reply Last reply
                0
                • N
                  N
                  Netvoid
                  wrote on last edited by
                  #15

                  Attaching results from,

                  show pollers
                  show queues
                  show flags
                  show mutex

                  After server has been up for about an hour rather than right after startup. I expect server crash in 2-4 hours. I will try to run these commands every hour while the server is up to help pinpoint....

                  Also ran a show stats,

                  netxmsd: show stats
                  Total number of objects:    9309
                  Number of monitored nodes:  3649
                  Number of collectable DCIs:  8147

                  netxms_debug_1.JPG

                  netxms_debug_2.JPG

                  netxms_debug_3.JPG

                  netxms_debug_4.JPG

                  1 Reply Last reply
                  0
                  • V
                    V
                    Victor Kirhenshtein
                    wrote on last edited by
                    #16

                    Hi!

                    Numbers are quite high, especially database writer queue. I would suggest to change some server parameters, taking into account number of nodes you have:

                    NumberOfStatusPollers = 100
                    NumberOfConfigurationPollers = 25
                    NumberOfRoutingTablePollers = 25

                    NumberOfDatabaseWriters = 5

                    I would also suggest to increase status and configuration polling intervals, which are one minute and one hour respectively. My recommended settings is to set configuration polling interval to at least 4 hours, and status polling interval to 90 seconds. It can be done by setting the following parameters:

                    StatusPollingInterval = 90
                    ConfigurationPollingInterval = 14400

                    Best regards,
                    Victor

                    1 Reply Last reply
                    0
                    • V
                      V
                      Victor Kirhenshtein
                      wrote on last edited by
                      #17

                      Few things I forgot:

                      • Remove ProcessAffinityMask option from netxmsd.conf. It does not help with the crash issue, but prevents using of all CPUs in the system.

                      • Some additional questions:

                      1. How many memory consumes netxmsd process? Is it growing?
                      2. What is the state of SQL server? So high value for database writer queue means that either NetXMS server cannot send requests as fast as needed or SQL server cannot process them as fast as needed. Increasing value for NumberOfDatabaseWriters will speed up request sending, but will SQL server be able to handle them?

                      Best regards,
                      Victor

                      1 Reply Last reply
                      0
                      • N
                        N
                        Netvoid
                        wrote on last edited by
                        #18

                        This hour stats..

                        netxmsd: show queues
                        Condition poller                : 0
                        Configuration poller            : 2978
                        Data collector                  : 0
                        Database writer                  : 181423
                        Event processor                  : 0
                        Network discovery poller        : 0
                        Node poller                      : 0
                        Routing table poller            : 0
                        Status poller                    : 2316

                        netxmsd: show mutex
                        Mutex status:
                          g_hMutexIdIndex: unlocked
                          g_hMutexNodeIndex: unlocked
                          g_hMutexSubnetIndex: unlocked
                          g_hMutexInterfaceIndex: unlocked

                        netxmsd: show flags
                        Flags: 0x43300257
                          AF_DAEMON                        = 1
                          AF_USE_SYSLOG                    = 1
                          AF_ENABLE_NETWORK_DISCOVERY      = 1
                          AF_ACTIVE_NETWORK_DISCOVERY      = 0
                          AF_LOG_SQL_ERRORS                = 1
                          AF_DELETE_EMPTY_SUBNETS          = 0
                          AF_ENABLE_SNMP_TRAPD            = 1
                          AF_ENABLE_ZONING                = 0
                          AF_SYNC_NODE_NAMES_WITH_DNS      = 0
                          AF_CHECK_TRUSTED_NODES          = 1
                          AF_WRITE_FULL_DUMP              = 0
                          AF_RESOLVE_NODE_NAMES            = 1
                          AF_CATCH_EXCEPTIONS              = 1
                          AF_INTERNAL_CA                  = 0
                          AF_DB_LOCKED                    = 1
                          AF_ENABLE_MULTIPLE_DB_CONN      = 1
                          AF_DB_CONNECTION_LOST            = 0
                          AF_NO_NETWORK_CONNECTIVITY      = 0
                          AF_EVENT_STORM_DETECTED          = 0
                          AF_SERVER_INITIALIZED            = 1
                          AF_SHUTDOWN                      = 0

                        netxmsd: show stats
                        Total number of objects:    9309
                        Number of monitored nodes:  3649
                        Number of collectable DCIs:  8147

                        netxms_debug_1.JPG

                        1 Reply Last reply
                        0
                        • N
                          N
                          Netvoid
                          wrote on last edited by
                          #19

                          Memory usage of the netxmsd before making all these changes and restarting was holding at about 130mb.

                          The database should be healthy, I'll watch the perfomance logs on that after these changes but the SQL server is low usage and on a higher performance segment of our SAN.

                          These suggestions,

                          StatusPollingInterval = 90
                          ConfigurationPollingInterval = 14400

                          I had already moved status interval to 90, so I bumped it to 120. The configuration I put at 14400 as you suggest and it was 3600.

                          Just restarted with the revised setting and removed the processor affinity. I'll check and post the stats in an hour.

                          1 Reply Last reply
                          0
                          • N
                            N
                            Netvoid
                            wrote on last edited by
                            #20

                            I am noticing a tremendous amount of these disconnect and reconnects in the event log since I revised the settings. I attached screen shot. I put the status poller interval back down to 90 from 120 in case that is the cause.

                            memory is sitting at 110mb after being up for an hour or so..

                            queues look like this now,

                            netxmsd: show queues
                            Condition poller                 : 0
                            Configuration poller             : 523
                            Data collector                   : 5343
                            Database writer                  : 0
                            Event processor                  : 0
                            Network discovery poller         : 0
                            Node poller                      : 0
                            Routing table poller             : 0
                            Status poller                    : 190

                            netxms_debug.JPG

                            1 Reply Last reply
                            0
                            • V
                              V
                              Victor Kirhenshtein
                              wrote on last edited by
                              #21

                              Queues looks much better now. The only possibly problematic number is data collector's queue. Is it always like this, or it was just a short pike? Btw, by default server create DCIs for internal queue sizes. If those DCIs are configured, could you post a charts of them for last hour or two?

                              1 Reply Last reply
                              0
                              • N
                                N
                                Netvoid
                                wrote on last edited by
                                #22

                                The client connectivity loss/restore entries all still quite high. Dozens every few minutes, as shown by the attached event log.


                                netxms_debug.JPG

                                netxms_data_collection_graph.JPG

                                1 Reply Last reply
                                0
                                • N
                                  N
                                  Netvoid
                                  wrote on last edited by
                                  #23

                                  Server responding very slowly now.. For example event log takes a minute to load up with a progress bar I had not seen before... The log is riddled with agent connection loss/restored messages. 50-100 clients are losing connection and restoring connections per minute.

                                  The queues are currently,

                                  netxmsd: show queues
                                  Condition poller                : 0
                                  Configuration poller            : 0
                                  Data collector                  : 0
                                  Database writer                  : 0
                                  Event processor                  : 0
                                  Network discovery poller        : 0
                                  Node poller                      : 0
                                  Routing table poller            : 0
                                  Status poller                    : 132

                                  netxmsd: show mutex
                                  Mutex status:
                                    g_hMutexIdIndex: unlocked
                                    g_hMutexNodeIndex: unlocked
                                    g_hMutexSubnetIndex: unlocked
                                    g_hMutexInterfaceIndex: unlocked

                                  netxmsd: show flags
                                  Flags: 0x43300257
                                    AF_DAEMON                        = 1
                                    AF_USE_SYSLOG                    = 1
                                    AF_ENABLE_NETWORK_DISCOVERY      = 1
                                    AF_ACTIVE_NETWORK_DISCOVERY      = 0
                                    AF_LOG_SQL_ERRORS                = 1
                                    AF_DELETE_EMPTY_SUBNETS          = 0
                                    AF_ENABLE_SNMP_TRAPD            = 1
                                    AF_ENABLE_ZONING                = 0
                                    AF_SYNC_NODE_NAMES_WITH_DNS      = 0
                                    AF_CHECK_TRUSTED_NODES          = 1
                                    AF_WRITE_FULL_DUMP              = 0
                                    AF_RESOLVE_NODE_NAMES            = 1
                                    AF_CATCH_EXCEPTIONS              = 1
                                    AF_INTERNAL_CA                  = 0
                                    AF_DB_LOCKED                    = 1
                                    AF_ENABLE_MULTIPLE_DB_CONN      = 1
                                    AF_DB_CONNECTION_LOST            = 0
                                    AF_NO_NETWORK_CONNECTIVITY      = 0
                                    AF_EVENT_STORM_DETECTED          = 0
                                    AF_SERVER_INITIALIZED            = 1
                                    AF_SHUTDOWN                      = 0

                                  The memory utilization is holding at about 121mb.

                                  1 Reply Last reply
                                  0
                                  • N
                                    N
                                    Netvoid
                                    wrote on last edited by
                                    #24

                                    After a couple minutes the event viewer started responding more quickly again..

                                    The queues went to all zero.

                                    And just as a heads up this is what my SQL server activity is looking like over the last while...


                                    sqlstat.JPG

                                    1 Reply Last reply
                                    0
                                    • S
                                      S
                                      Sumit Pandya
                                      wrote on last edited by
                                      #25

                                      Very random post... Please ensure that your network connectivity is stable. I experienced random NetXMS problem/behavior when network availability fluctuates.
                                      Just give a try to install "Microsoft Loopback Adapter" from Add Hardware Wizard. Assign some Private IP (Other then your network). I'm sure there is no harm in installing loopback adapter

                                      1 Reply Last reply
                                      0
                                      • N
                                        N
                                        Netvoid
                                        wrote on last edited by
                                        #26

                                        Server has not crashed in almost 24 hours. The only remaning issue seems to be the connectivity loss of the agents dropping and restoring.

                                        1 Reply Last reply
                                        0
                                        • V
                                          V
                                          Victor Kirhenshtein
                                          wrote on last edited by
                                          #27

                                          I suspect that it may hit some limits for open connections. There was a limit of around 4000 outgoing TCP connections in Windows 2003, I'm not sure how it is in Windows 2008. Could you please run netstat -n and count connections to external IPs on port 4700? And how many of them are not in ESTABLISHED state?

                                          Best regards,
                                          Victor

                                          1 Reply Last reply
                                          0

                                          Hello! It looks like you're interested in this conversation, but you don't have an account yet.

                                          Getting fed up of having to scroll through the same posts each visit? When you register for an account, you'll always come back to exactly where you were before, and choose to be notified of new replies (either via email, or push notification). You'll also be able to save bookmarks and upvote posts to show your appreciation to other community members.

                                          With your input, this post could be even better 💗

                                          Register Login
                                          Reply
                                          • Reply as topic
                                          Log in to reply
                                          • Oldest to Newest
                                          • Newest to Oldest
                                          • Most Votes


                                          • Login

                                          • Don't have an account? Register

                                          • Login or register to search.
                                          Powered by NodeBB Contributors
                                          • First post
                                            Last post
                                          0
                                          • Categories
                                          • Recent
                                          • Tags
                                          • Popular
                                          • Users
                                          • Groups