
DCI Table help, please
-
Hi All, new here. Have been playing with NetXMS for the last couple of days, and I need some assistance with DCI tables and getting data into them via SNMP. I'd previously tried out Zabbix, and had managed to discover instances for each firewall policy on a Netscreen firewall, grab the statistics, and then show a graph for each firewall policy.
I'm trying to replicate this in NetXMS, and I'm stuck as there's no documentation that I can find on DCI tables. I'm running 1.2.8 on Windows, with PostgreSQL
I'm already monitoring the normal interface stats and details like processor/memory utilisation on this firewall.
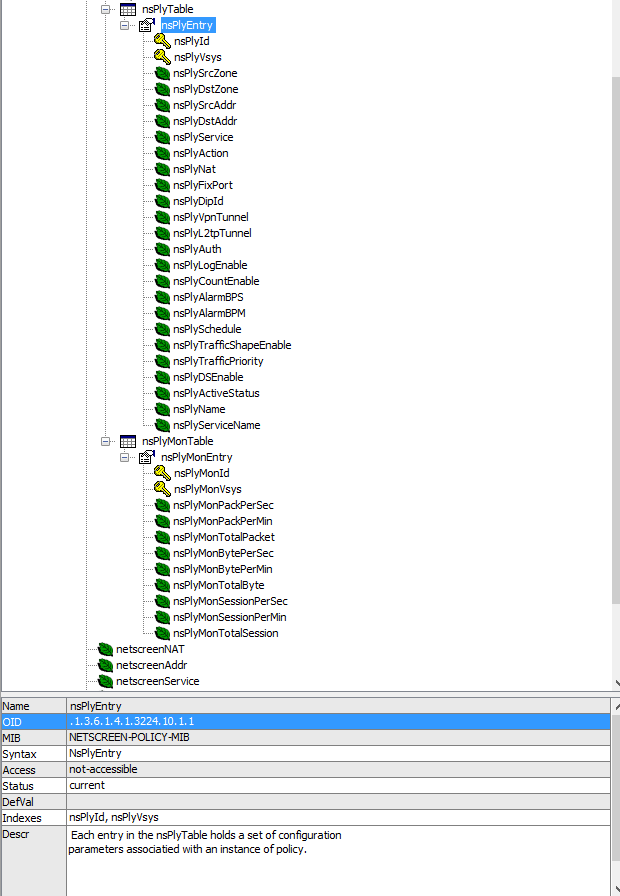
There are two tables accessible via SNMP. First, the policy entry table at .1.3.6.1.4.1.3224.10.1, and then the policy monitoring table at .1.3.6.1.4.1.3224.10.2
The confusing part is that the Policy ID is then used as part of the OID, so for example, policy ID 371 would look like this:
- Name (OID): Value
- nsPlyId (.1.3.6.1.4.1.3224.10.1.1.1.371.0): 371
- nsPlyVsys (.1.3.6.1.4.1.3224.10.1.1.2.371.0): 0
- nsPlySrcZone (.1.3.6.1.4.1.3224.10.1.1.3.371.0): "DMZ"
- ...snip
- nsPlyName (.1.3.6.1.4.1.3224.10.1.1.24.371.0): "xyz Policy"
Then, monitoring stats are in another table with the same instance key - being the policy ID
- Name (OID): Value
- nsPlyMonBytePerSec (.1.3.6.1.4.1.3224.10.2.1.6.371.0): 6140
- nsPlyMonSessionPerSec (.1.3.6.1.4.1.3224.10.2.1.9.371.0): 58
Any ideas?
Thanks,
Daniel
-
Hi!
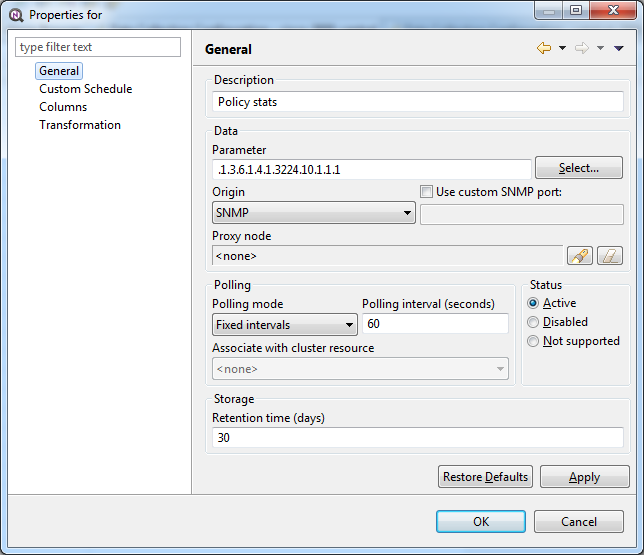
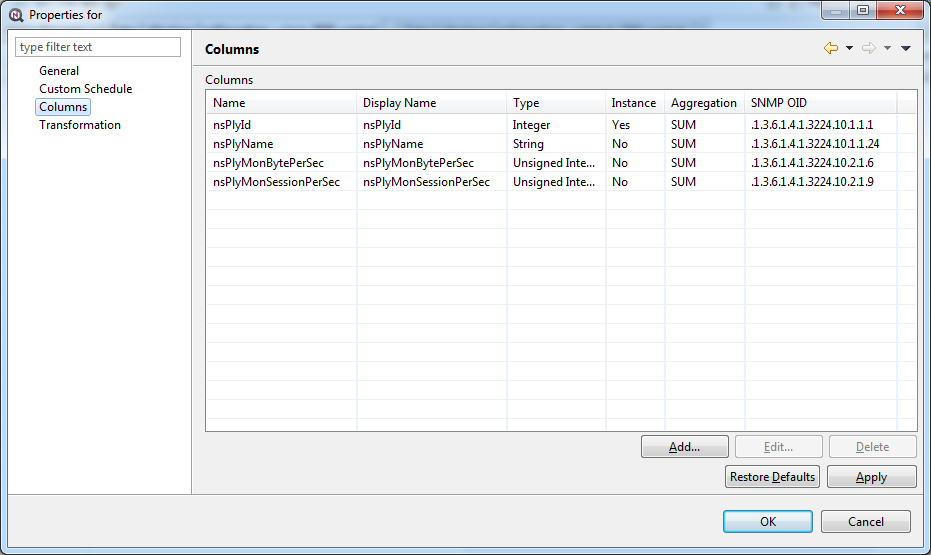
You have to create table DCI as following:
- enter "base" OID as parameter on "General" page, .1.3.6.1.4.1.3224.10.1.1.1 in your case
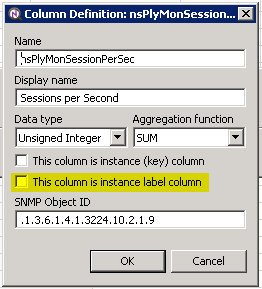
- add desired columns on "Columns" page, and set SNMP OID for each column to contain only non-changing part, like .1.3.6.1.4.1.3224.10.1.1.3
and that's it. I've attached screenshots with table DCI config that should work (but didn't test it as I don't have such device).
Best regards,
Victor
-
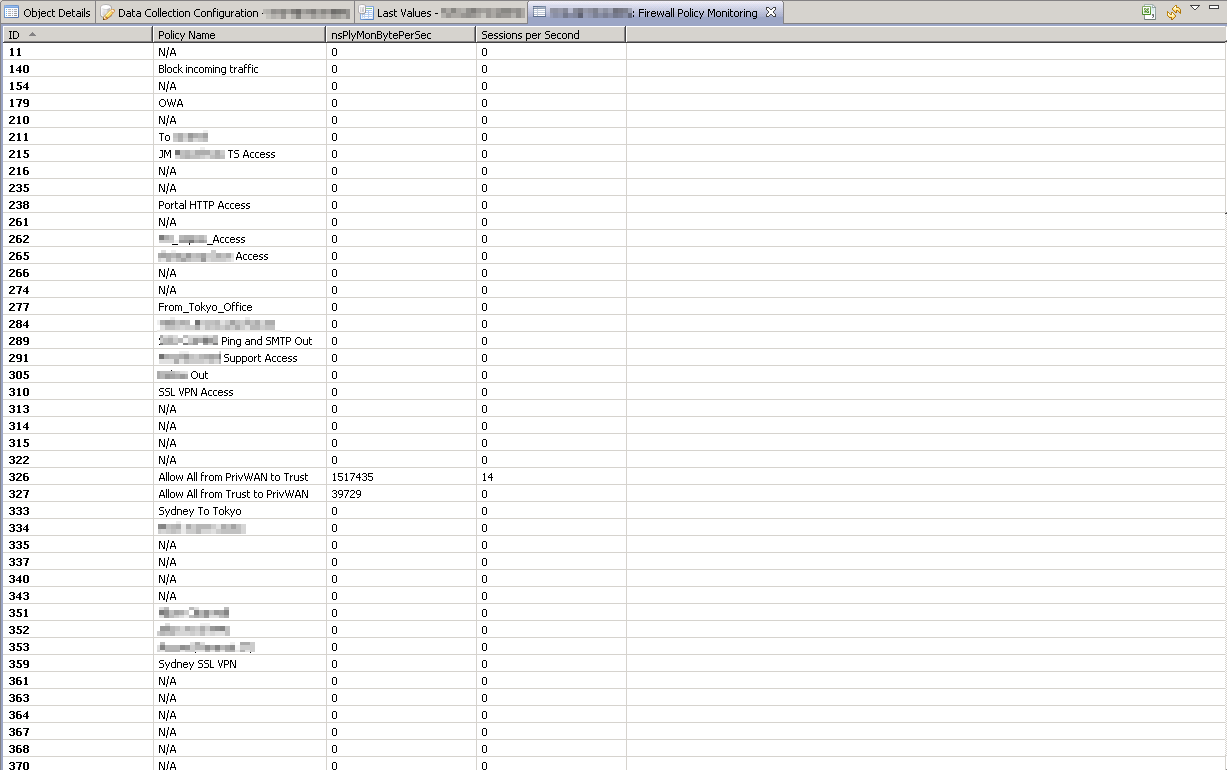
Thanks so much, Victor! So easy when you know what you're doing...

That was much more straight-forward than how I'd done it before in Zabbix. The only thing I miss when compared to Zabbix is being able to template a bunch of graphs.
Now I just need to figure out how to graph all of these statistics. Any pointers on that without generating several hundred graphs manually?
Also another quick question - what does "This column is instance label column" do?
Thanks again,
Daniel
-
@dstreefkerk said in DCI Table help, please:
That was much more straight-forward than how I'd done it before in Zabbix. The only thing I miss when compared to Zabbix is being able to template a bunch of graphs.
Now I just need to figure out how to graph all of these statistics. Any pointers on that without generating several hundred graphs manually?
You can right-click any cell (or selected group of cells) in the table and open historical graph for it from context menu. But there are no easy way to automatically populate predefined graphs tree or dashboards, which is you're looking for if I understand correctly. Sounds like nice feature, I'll add it to our feature request list.
@dstreefkerk said in DCI Table help, please:
Also another quick question - what does "This column is instance label column" do?
Currently nothing. In the next release, value from this column will be used in graph legends instead of value from key column (because often key column is some sort of ID and you need to present display name instead).
Best regards,
Victor -
@victor said in DCI Table help, please:
You can right-click any cell (or selected group of cells) in the table and open historical graph for it from context menu. But there are no easy way to automatically populate predefined graphs tree or dashboards, which is you're looking for if I understand correctly. Sounds like nice feature, I'll add it to our feature request list.
Great!
Thanks for your help. I have one more question. If I have an OID in that table that I'm monitoring called nsPlyCountEnable, can I create a script that only retrieves instances where the value of nsPlyCountEnable is 1?
-
Not yet. It is possible to create a transformation script for the table now, but you cannot delete rows from it. In release 1.2.9 we will have table methods deleteRow and deleteColumn, and then you'll be able to remove unneeded rows from resulting table.
If you have relatively small amount of rows and columns you want to collect, you can use instance discovery instead of tables. Some information about instance discovery is in wiki: http://wiki.netxms.org/wiki/UM:Data_Collection#Instance_Discovery. There are also screencast that could be helpful: http://www.youtube.com/watch?v=HSs9mP_0XK0. ANd this topic on forum could be useful: https://www.netxms.org/forum/configuration/instance-discovery-filter-scrip/.
Best regards,
Victor
Hello! It looks like you're interested in this conversation, but you don't have an account yet.
Getting fed up of having to scroll through the same posts each visit? When you register for an account, you'll always come back to exactly where you were before, and choose to be notified of new replies (either via email, or push notification). You'll also be able to save bookmarks and upvote posts to show your appreciation to other community members.
With your input, this post could be even better 💗
Register Login