
Stacked charts vs inverted values
-
It seems to me that inverting values on a chart prevents the values from being stacked.
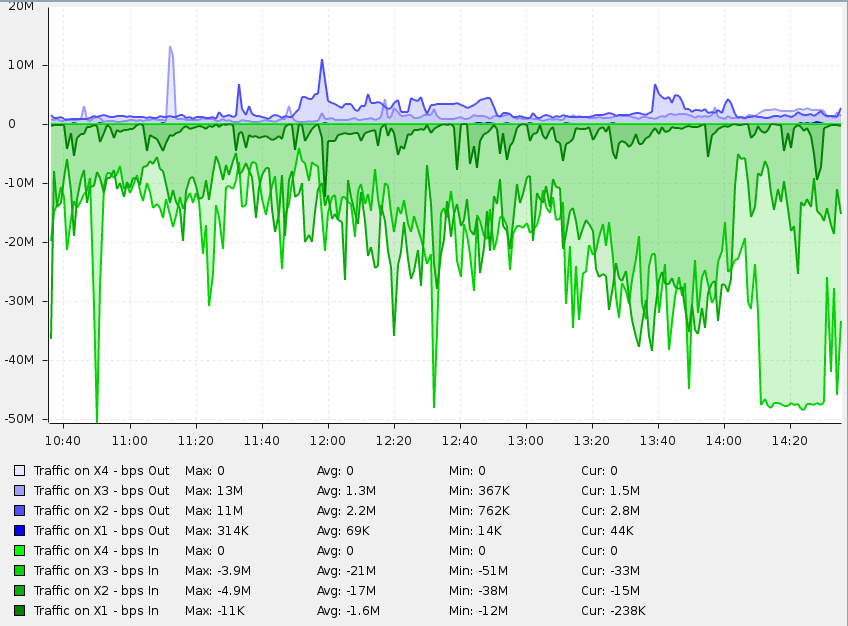
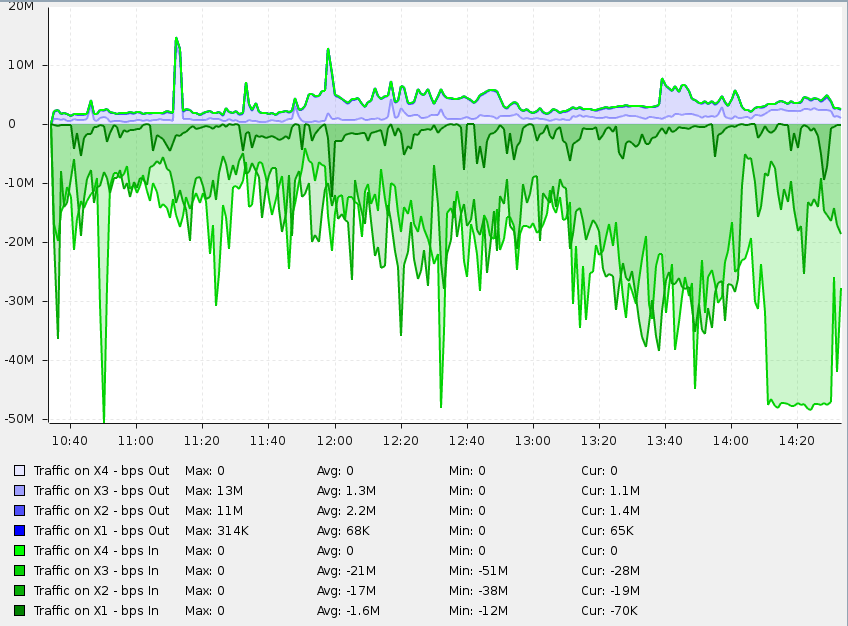
Four WAN interfaces on one firewall, plotted on one chart. The positive DCIs seem to be stacked correctly but negatively is not. Alternatively, I might be misunderstanding how stacked graphs should work.
-
-
I have posted the same graph twice, one with stack enabled, one without and I think it demonstrates two distinct issues.
-
Negative is not stacked.
-
A DCI that I have specified to be inverted but in this dataset happens to be 0 for the entire series [WAN link is down so throughput is 0] is rendered above the positive values rather than at x=0. See the thin green line on the top of nxwanstack.png. Is this worth opening a separate bug for?
-
-
-

Hello! It looks like you're interested in this conversation, but you don't have an account yet.
Getting fed up of having to scroll through the same posts each visit? When you register for an account, you'll always come back to exactly where you were before, and choose to be notified of new replies (either via email, or push notification). You'll also be able to save bookmarks and upvote posts to show your appreciation to other community members.
With your input, this post could be even better 💗
Register Login