Skip to content
  • Categories
  • Recent
  • Tags
  • Popular
  • Users
  • Groups
Skins
  • Light
  • Brite
  • Cerulean
  • Cosmo
  • Flatly
  • Journal
  • Litera
  • Lumen
  • Lux
  • Materia
  • Minty
  • Morph
  • Pulse
  • Sandstone
  • Simplex
  • Sketchy
  • Spacelab
  • United
  • Yeti
  • Zephyr
  • Dark
  • Cyborg
  • Darkly
  • Quartz
  • Slate
  • Solar
  • Superhero
  • Vapor

  • Default (Flatly)
  • No Skin
Collapse
Brand Logo

NetXMS Forum

  1. Home
  2. Support
  3. Version 2.1-M3 Dashboard Issue

Version 2.1-M3 Dashboard Issue

Scheduled Pinned Locked Moved Support
4 Posts 2 Posters 9.9k Views
  • Oldest to Newest
  • Newest to Oldest
  • Most Votes
Reply
  • Reply as topic
Log in to reply
This topic has been deleted. Only users with topic management privileges can see it.
  • K
    K
    kummerr
    wrote on last edited by
    #1

    Hi-

    I have created several dashboards that have working flawlessly for several months.  After updating from V2.1-M2 to V2.1-M3 the line chart dashboard elements are not updating consistently.  I have verified that the DCI is configured properly and there is data in the database for the entire period.  I am using MySQL 5.6 for a database and have found that if I stop and restart the NetXMS Core service the problem goes away temporarily. 

    The attached screen shot shows an example of before and after the update which occurred on April 3rd.

    Any thoughts on how to resolve this issue?

    Thanks in advance!
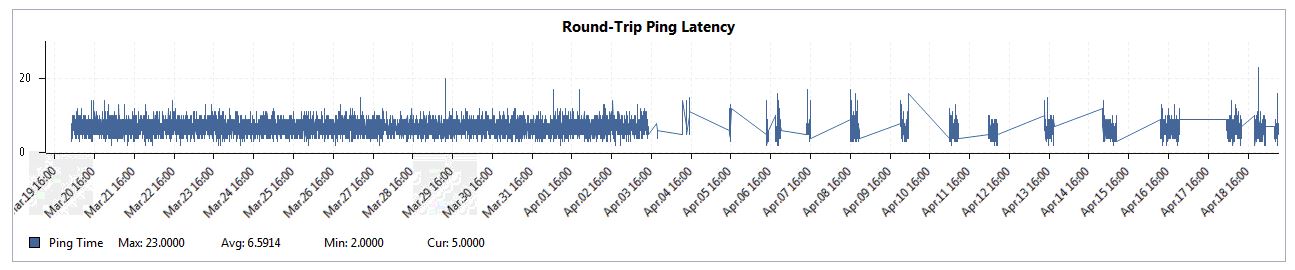

    NetXMS Dashboard Issue.JPG

    1 Reply Last reply
    0
    • S
      S
      Ēriks Jenkēvics
      wrote on last edited by
      #2

      Hi!

      Could you, please, provide which OS you are using, your server version and your agent version? Also, do you have agent data caching mode turned on?

      1 Reply Last reply
      0
      • K
        K
        kummerr
        wrote on last edited by
        #3

        NetXMS v2.1-M3-x64 is running on Windows 7 Enterprise edition.  The devices I'm monitoring are IP based wireless radios so I'm not using the agent.  I'm using a subagent to capture ping times and SNMP to capture all the other parameters I have setup on my dashboards.  I do have the agent (v2.1-M3-x64) installed on the NetXMS server as well.  I'm seeing the same gaps in the dashboard data from both the internal and SNMP origins within the DCI (see attached).
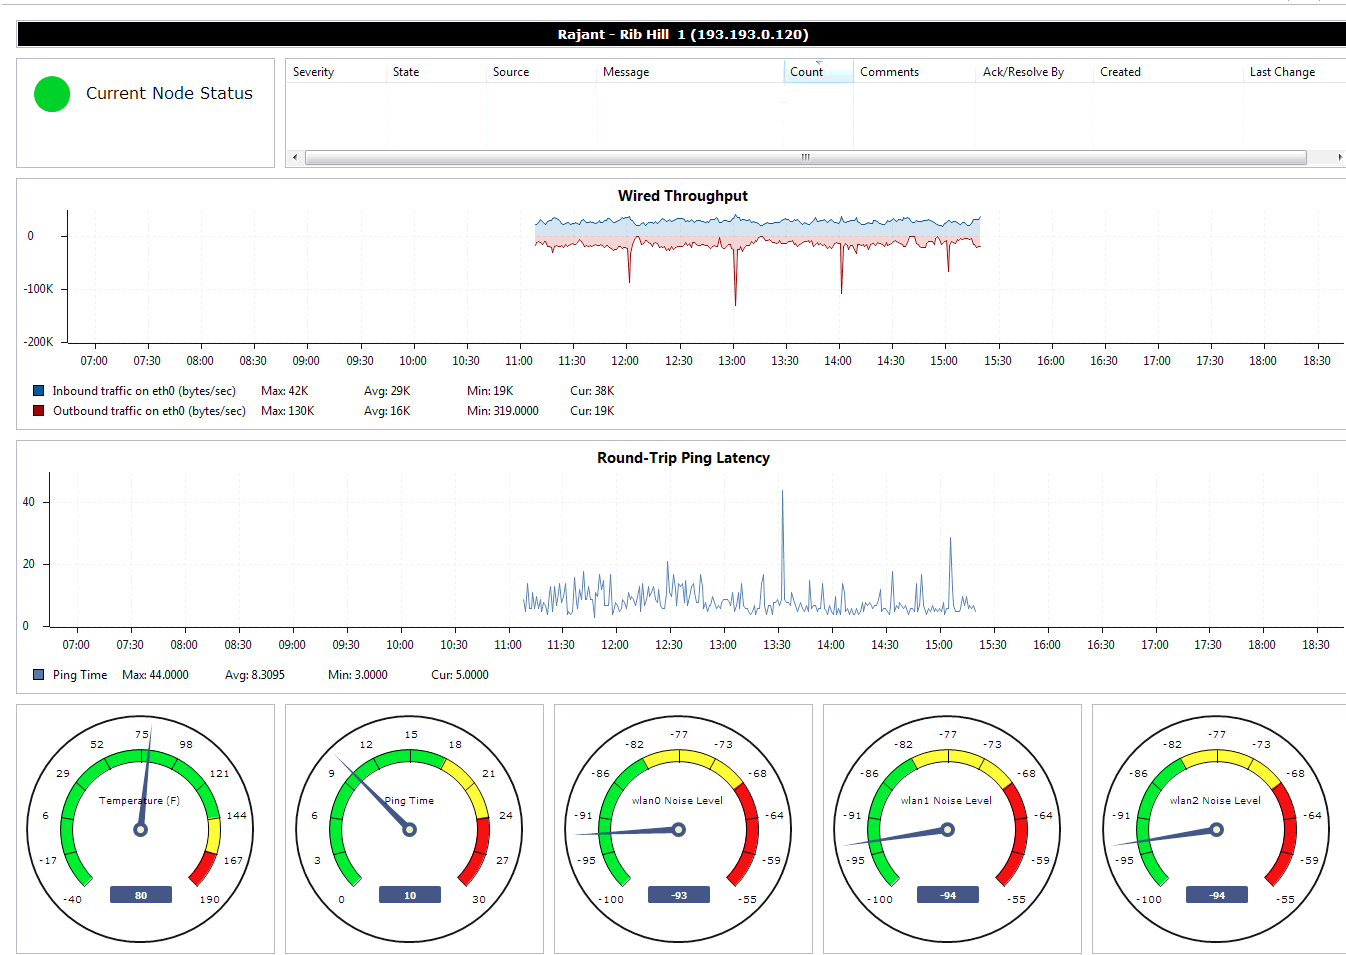

        NetXMS Dashboard.png

        1 Reply Last reply
        0
        • K
          K
          kummerr
          wrote on last edited by
          #4

          I'm not sure what was done, but this seems to have been resolved in the latest release (Version 2.1).

          Happiness - Thank you!!!


          NetXMS Dashboard Resolved.PNG

          1 Reply Last reply
          0

          Hello! It looks like you're interested in this conversation, but you don't have an account yet.

          Getting fed up of having to scroll through the same posts each visit? When you register for an account, you'll always come back to exactly where you were before, and choose to be notified of new replies (either via email, or push notification). You'll also be able to save bookmarks and upvote posts to show your appreciation to other community members.

          With your input, this post could be even better 💗

          Register Login
          Reply
          • Reply as topic
          Log in to reply
          • Oldest to Newest
          • Newest to Oldest
          • Most Votes


          • Login

          • Don't have an account? Register

          • Login or register to search.
          Powered by NodeBB Contributors
          • First post
            Last post
          0
          • Categories
          • Recent
          • Tags
          • Popular
          • Users
          • Groups