
Latest Grafana 5.2.0 does not work with NetXMS data source plugin
-
The NetXMS Grafana data source plugin does not work (it gives an error and won't load the data source plugin page correctly).
I run Grafana in a container and deploy via Docker Compose, so my environment is controlled carefully.
History:
Grafana 5.1.2 = works ok with NetXMS data source plugin
Grafana 5.1.3 = works ok with NetXMS data source plugin
Grafana 5.1.4 = Grafana folks broke LDAP, could not use this version
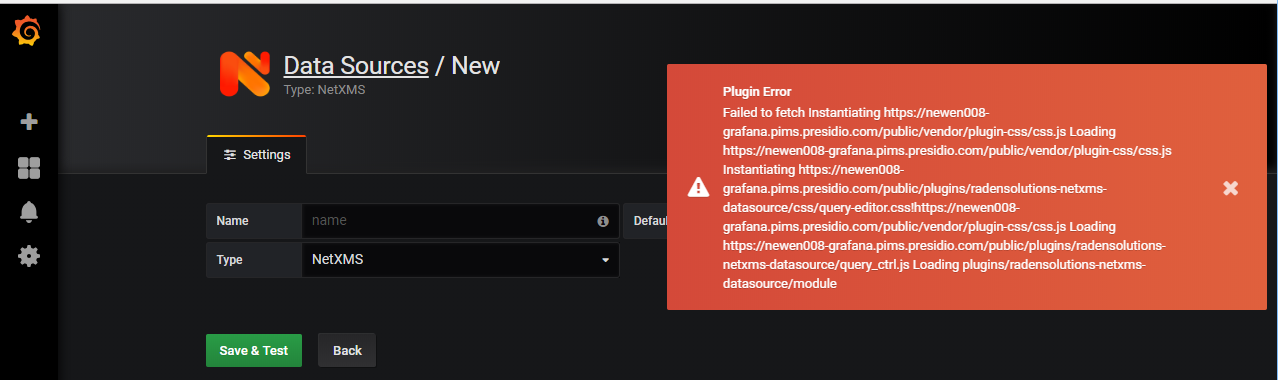
Grafana 5.2.0 = LATEST (adds fixes needed for other stuff I use) <-- NetXMS data source plugin fails to loadError:
Plugin Error
Failed to fetch Instantiating https://newen008-grafana.pims.presidio.com/public/vendor/plugin-css/css.js Loading https://newen008-grafana.pims.presidio.com/public/vendor/plugin-css/css.js Instantiating https://newen008-grafana.pims.presidio.com/public/plugins/radensolutions-netxms-datasource/css/query-editor.css!https://newen008-grafana.pims.presidio.com/public/vendor/plugin-css/css.js Loading https://newen008-grafana.pims.presidio.com/public/plugins/radensolutions-netxms-datasource/query_ctrl.js Loading plugins/radensolutions-netxms-datasource/moduleThis leaves us in a bad position.
I need Grafana 5.2.0 for the latest fixes for my other stuff (Elastic)
but
Only Grafana 5.1.3 (and older) works with the NetXMS data source plugin.Can anyone please take a look and update the NetXMS data source plugin to work with Grafana 5.2.0 (and higher)?
-
Hi!
I've just tested the plugin with the latest version of Grafana (5.2.0) and all seems to be working for me. Could you please reinstall the NetXMS plugin and see if it changes anything?
Regards,
Eriks -
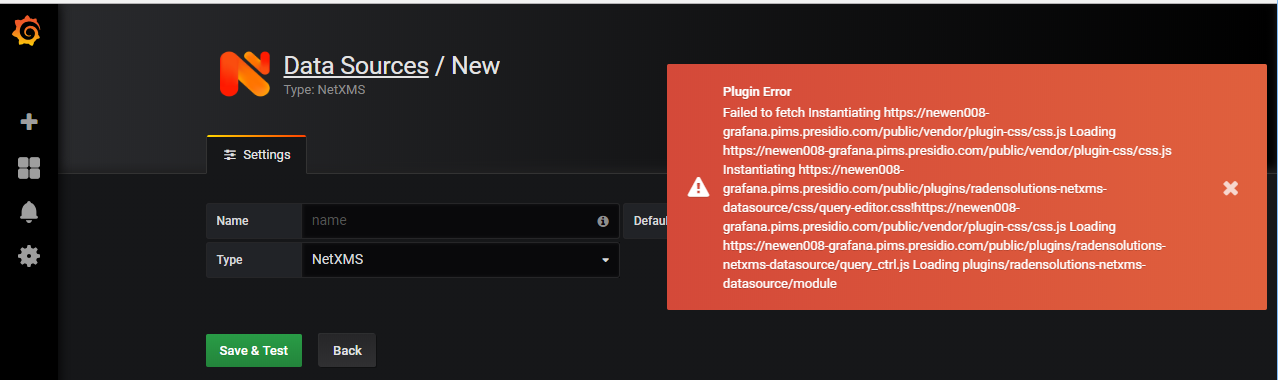
I tried on new and old and reinstalled the plugin, no joy on adding a new NetXMS data source on 5.2.0 - see attached screen capture
-
Hi!
Could you specify how you installed the plugin? Was it via the Grafana client using the command
grafana-cli plugins install radensolutions-netxms-datasourceor did you clone the GitHub repository of the plugin? -
I did attempt manually via:
grafana-cli plugins install radensolutions-netxms-datasource
and that did not help.My normal install is automated using Docker Compose and bind mounting:
# Create the bind mount for Grafana
mkdir -p /opt/grafana
cp ldap.toml /opt/grafana/
chown -R 472:472 /opt/grafana
chmod a+rw -R /opt/grafana# docker-compose.yml
version: '3.4'services:
# Grafana: https://hub.docker.com/r/grafana/grafana/
grafana:
image: grafana/grafana:5.2.0
hostname: grafana
environment:
- GF_SERVER_PROTOCOL=http
- GF_AUTH_LDAP_ENABLED=true
- GF_AUTH_LDAP_CONFIG_FILE=/var/lib/grafana/ldap.toml
- GF_INSTALL_PLUGINS=grafana-clock-panel,grafana-simple-json-datasource,grafana-piechart-panel,percona-percona-app,raintank-kubernetes-app,ntop-ntopng-datasource,natel-plotly-panel,camptocamp-prometheus-alertmanager-datasource,vonage-status-panel,fetzerch-sunandmoon-datasource,radensolutions-netxms-datasource
volumes:
- type: bind
source: /opt/grafana
target: /var/lib/grafana
networks:
- logging-net1
ports:
- mode: host
target: 3000
published: 3000
deploy:
labels:
local.description: "Grafana"networks:
logging-net1:# Deploy to Docker
############
# Run Graylog on the Swarm
docker stack deploy -c docker-compose.yml grafana
# Verify
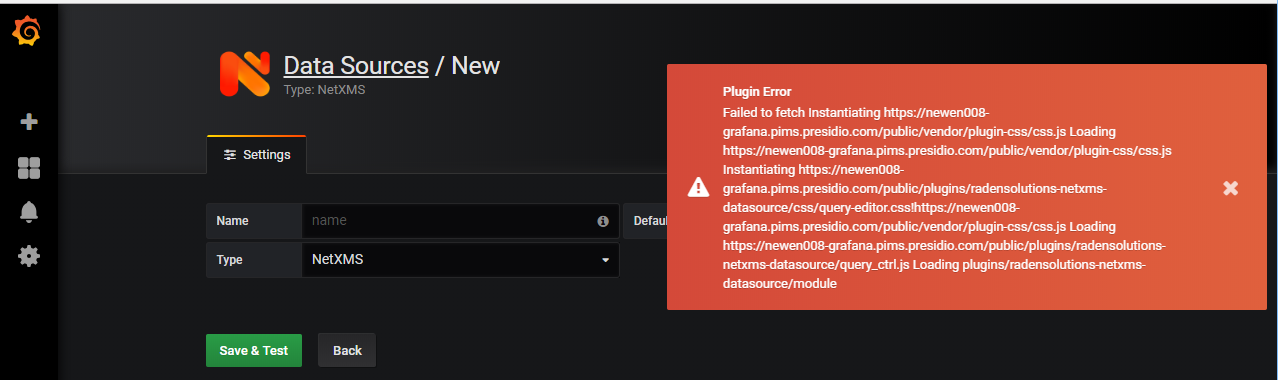
docker service ls | grep grafanaThen login to Grafana and try to add a new NetXMS data source and boom (see attached screen capture).
Note: The same docker-compose.yml above works fine with older versions of the Grafana Docker image, only changing one line:
image: grafana/grafana:5.1.2 <--works
image: grafana/grafana:5.1.3 <--works
image: grafana/grafana:5.2.0 <--fails as described
-
Hi!
I just deployed Grafana on Docker and everything seems to be working, I installed the same plugins on the same version of Grafana you are using (5.2.0). Could you try deploying the container without swarm? If it works, then the problem could be somewhere in your configuration, this is the command I used
docker run -e "GF_SERVER_PROTOCOL=http" -e "GF_INSTALL_PLUGINS=grafana-clock-panel,grafana-simple-json-datasource,grafana-piechart-panel,percona-percona-app,raintank-kubernetes-app,ntop-ntopng-datasource,natel-plotly-panel,camptocamp-prometheus-alertmanager-datasource,vonage-status-panel,fetzerch-sunandmoon-datasource,radensolutions-netxms-datasource" -d --name=grafana -p 3000:3000 grafana/grafana:5.2.0
Also I noticed that Grafana version 5.2.1 is available, maybe that will solve the issue.Regards,
Eriks -
image: grafana/grafana:5.2.1 works!
Thanks for everyone's help!
I guess we can close this.

Hello! It looks like you're interested in this conversation, but you don't have an account yet.
Getting fed up of having to scroll through the same posts each visit? When you register for an account, you'll always come back to exactly where you were before, and choose to be notified of new replies (either via email, or push notification). You'll also be able to save bookmarks and upvote posts to show your appreciation to other community members.
With your input, this post could be even better 💗
Register Login