Skip to content
  • Categories
  • Recent
  • Tags
  • Popular
  • Users
  • Groups
Skins
  • Light
  • Brite
  • Cerulean
  • Cosmo
  • Flatly
  • Journal
  • Litera
  • Lumen
  • Lux
  • Materia
  • Minty
  • Morph
  • Pulse
  • Sandstone
  • Simplex
  • Sketchy
  • Spacelab
  • United
  • Yeti
  • Zephyr
  • Dark
  • Cyborg
  • Darkly
  • Quartz
  • Slate
  • Solar
  • Superhero
  • Vapor

  • Default (Flatly)
  • No Skin
Collapse
Brand Logo

NetXMS Forum

  1. Home
  2. Support
  3. How to use monitoring services to monitor web address

How to use monitoring services to monitor web address

Scheduled Pinned Locked Moved Support
3 Posts 2 Posters 26.6k Views
  • Oldest to Newest
  • Newest to Oldest
  • Most Votes
Reply
  • Reply as topic
Log in to reply
This topic has been deleted. Only users with topic management privileges can see it.
  • G
    G
    gpd
    wrote on last edited by
    #1

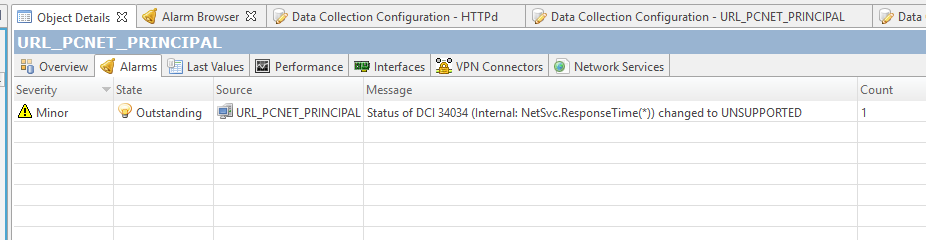
    I followed the documentation (the two options-node/DCI). But I'm not getting the desired result. Displays error (NetSvc. ResponseTime UNSPPORTED); I couldn't find the Service. Check. xxxxx parameter.

    I would like to get results of the type (response time, Bytes received, time DNS resolution, load/download time, TCP time and connection, latency, availability). Someone has some documentation on it.

    Cássio


    Error-teste-URL-2.PNG

    Error-teste-URL.PNG

    1 Reply Last reply
    0
    • F
      F
      Filipp Sudanov
      wrote on last edited by
      #2

      Hi!

      The first thing to check is if netsvc subagent is loaded on the agent that is performing the check.
      It's the concept of NetXMS that agent performs only a part of checks and many checks are done by subagents that have to be congigured in agent configuration file: https://www.netxms.org/documentation/adminguide/agent-management.html#agent-configuration-files

      1 Reply Last reply
      0
      • G
        G
        gpd
        wrote on last edited by
        #3

        Hello, Sudanov.

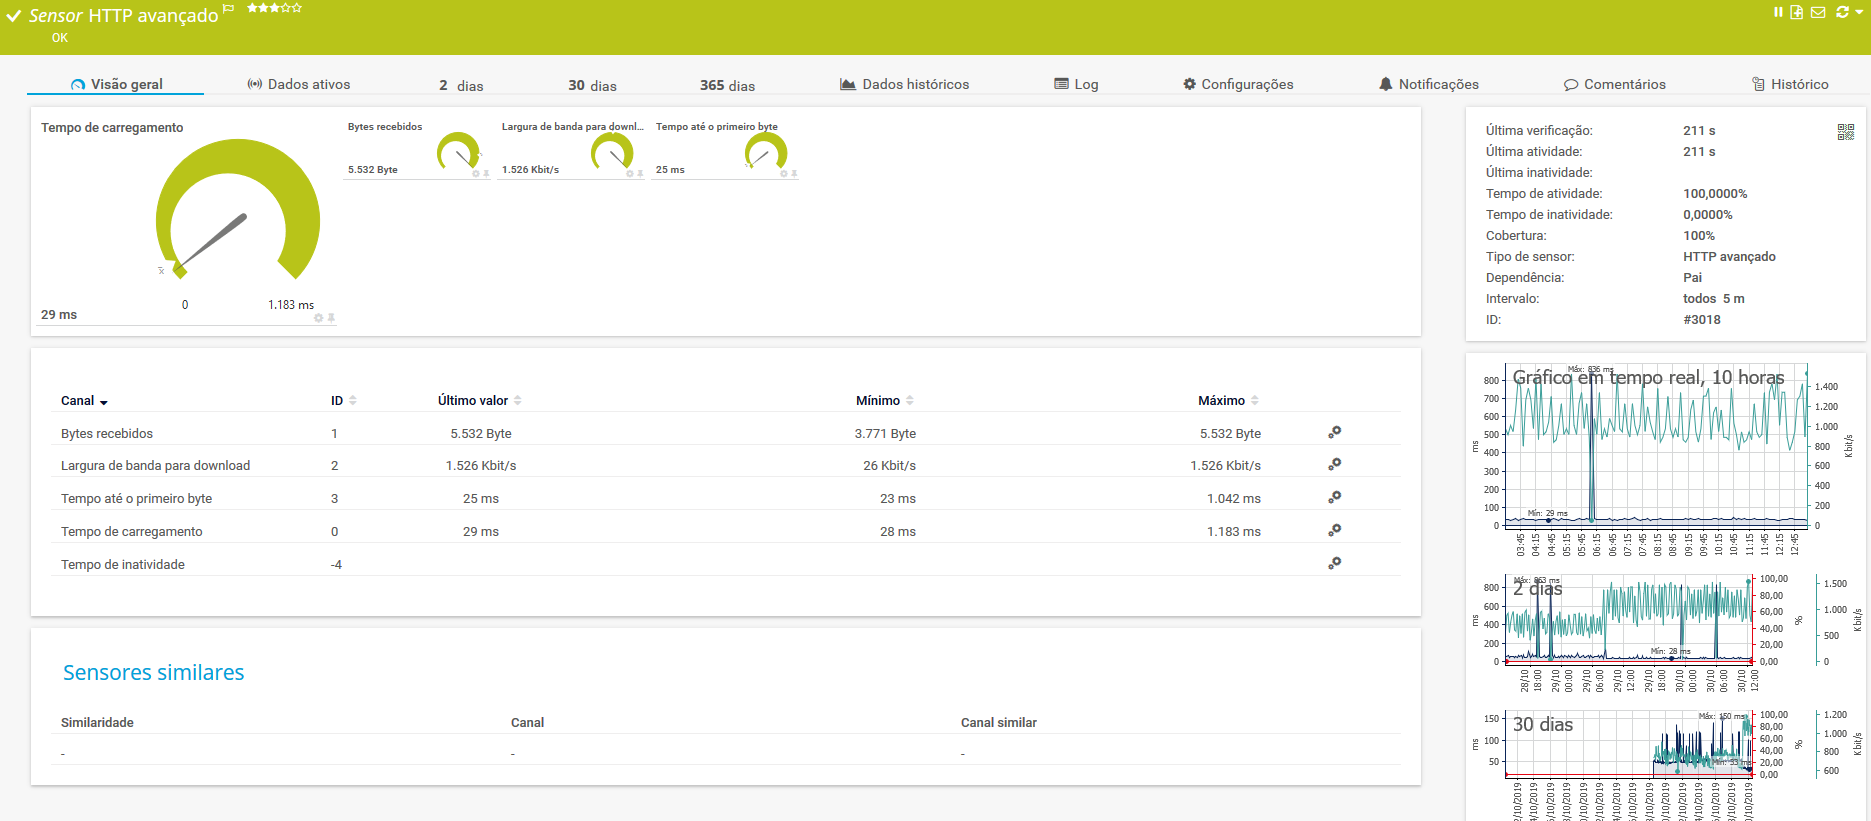
        The nxagent.conf file is configured and running according to the documentation (active as log), but I still can't view/create an response time, Bytes received, time DNS resolution, load/download time, TCP time and connection, latency, availability chart. 😞

        See the examples attached

        Thanks
        Cássio
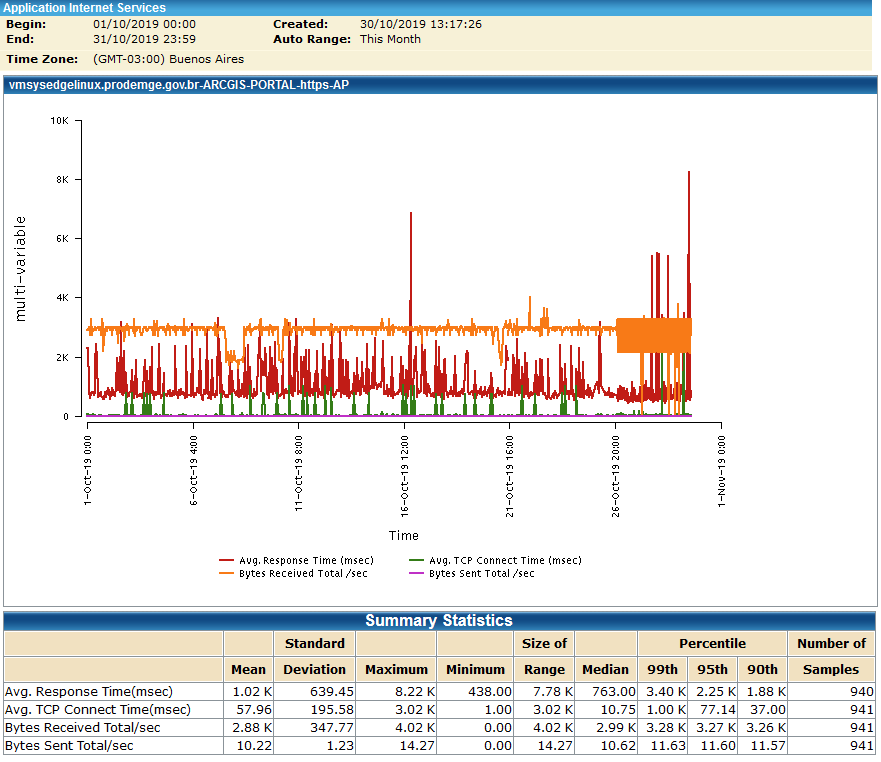

        Example CA BROADCOM EHEALTH MANAGER.PNG

        Example PRTG.PNG

        1 Reply Last reply
        0

        Hello! It looks like you're interested in this conversation, but you don't have an account yet.

        Getting fed up of having to scroll through the same posts each visit? When you register for an account, you'll always come back to exactly where you were before, and choose to be notified of new replies (either via email, or push notification). You'll also be able to save bookmarks and upvote posts to show your appreciation to other community members.

        With your input, this post could be even better 💗

        Register Login
        Reply
        • Reply as topic
        Log in to reply
        • Oldest to Newest
        • Newest to Oldest
        • Most Votes


        • Login

        • Don't have an account? Register

        • Login or register to search.
        Powered by NodeBB Contributors
        • First post
          Last post
        0
        • Categories
        • Recent
        • Tags
        • Popular
        • Users
        • Groups