
Retention of averaged history data
-
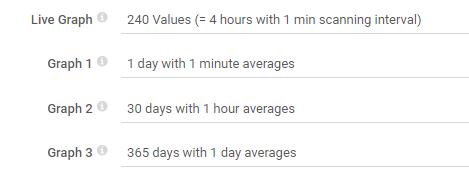
Hello, is there a way to set NetXMS up to do summarization/averageing of historic data? For example, if I collect some data every 60 seconds (polling interval) and save that data for 10 days (retention period), is it possible to also keep hourly averages for 30 days and daily averages for 1 year? The system I am currently using offers option as shown in attached picture.
-
No such functionality is currently implemented. It could be a valid approach, but such averages tend to look differently then original data - e.g. spikes are smoothed. It could be possible to keep 3 values - min, max and average, but then it complicated the system and requires more development effort.
Since storage is quire cheap these days, a simpler approach is just to store more data - with Postgres time scale DB it's possible to delete old data with minimal load onto the database. -
You can build something similar inside NetXMS, but it requires more effort.
You could create three DCIs: 60s DCI, 1h DCI, 1d DCI.
The first one is a standard DCI, the other two are script DCIs.
On their poll interval, the scripts DCIs pull the data from the standard DCI and calculate the average (there's a function GetAvgDCIValue that will do that for you).
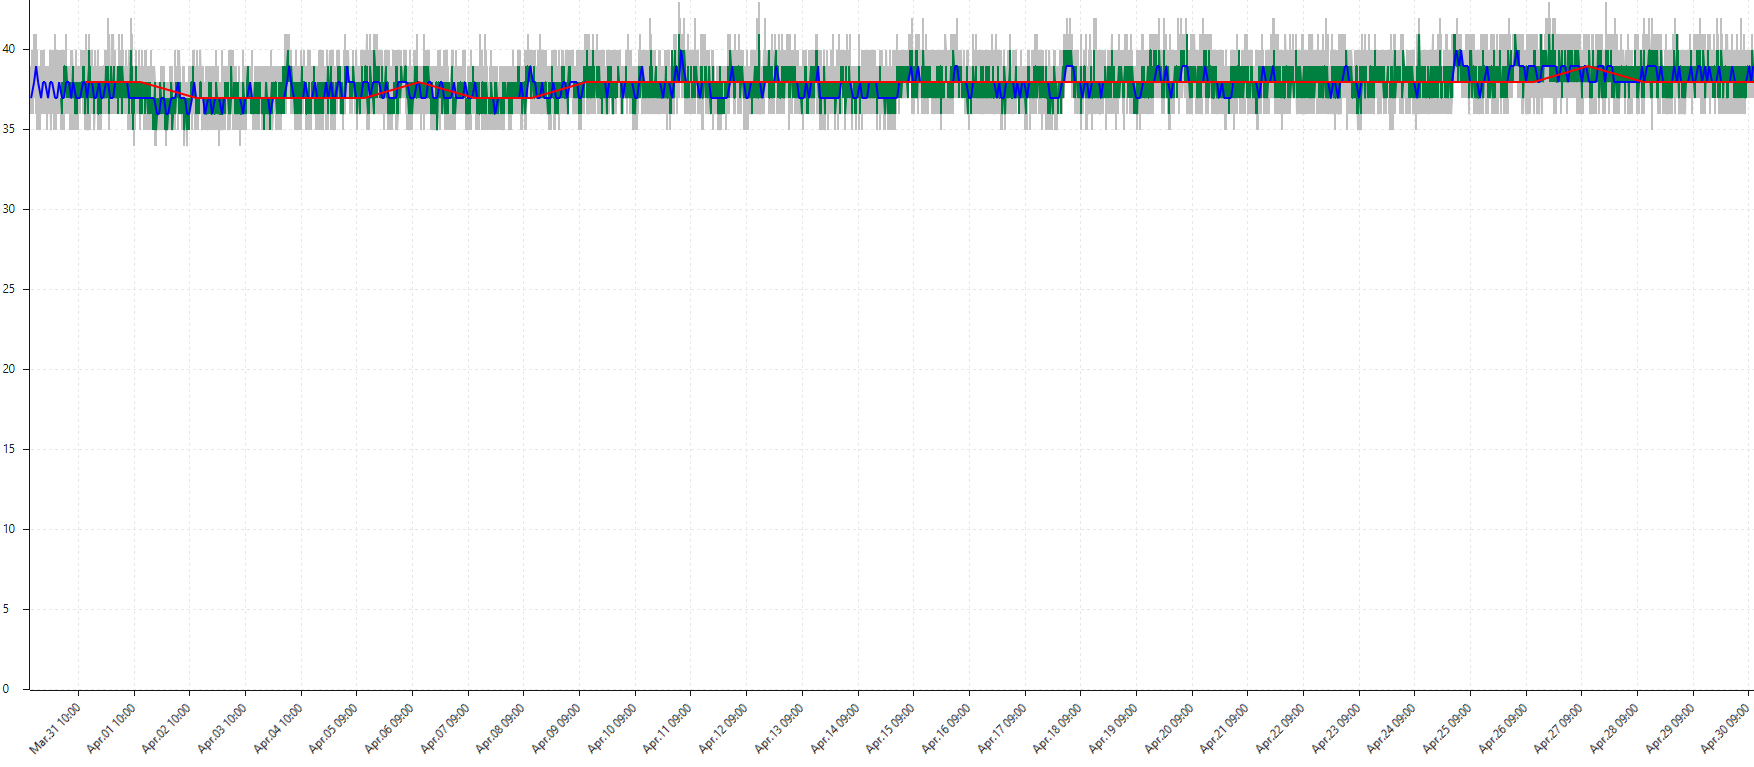
Set retention as required on each DCI.The result could look something like the attached screenshot (note that I do not have different retention enabled here - if you do, you'd see different part of the graph stop at some point).
It is not quite the same as what you are looking at and it is certainly more complicated to setup than ticking a couple of checkboxes - but it is an option, should you require it.
Hello! It looks like you're interested in this conversation, but you don't have an account yet.
Getting fed up of having to scroll through the same posts each visit? When you register for an account, you'll always come back to exactly where you were before, and choose to be notified of new replies (either via email, or push notification). You'll also be able to save bookmarks and upvote posts to show your appreciation to other community members.
With your input, this post could be even better 💗
Register Login