
node status
-
Hi.
NetXMS is monitoring nodes over a VPN.Every so often, the VPN will die. When this happens, NetXMS (rightfully) marks the nodes as down but when the VPN comes back, the nodes never get marked as up.
If I manually run the status it says the following
[10.02.2021 09:00:09] **** Poll request sent to server ****
[10.02.2021 09:00:09] Poll request accepted
[10.02.2021 09:00:14] Starting status poll for node Remote-RouterOS RB960PGS-6.40.9
[10.02.2021 09:00:14] Checking SNMP agent connectivity
[10.02.2021 09:00:14] Starting status poll on interface ether1
[10.02.2021 09:00:14] Current interface status is NORMAL
[10.02.2021 09:00:14] Retrieving interface status from SNMP agent
[10.02.2021 09:00:14] Interface status retrieved from SNMP agent
[10.02.2021 09:00:14] Interface is NORMAL for 357 polls (1 poll required for status change)
[10.02.2021 09:00:14] Interface status after poll is NORMAL
[10.02.2021 09:00:14] Finished status poll on interface ether1
[10.02.2021 09:00:14] Starting status poll on interface ether2
[10.02.2021 09:00:14] Current interface status is NORMAL
[10.02.2021 09:00:14] Retrieving interface status from SNMP agent
[10.02.2021 09:00:14] Interface status retrieved from SNMP agent
[10.02.2021 09:00:14] Interface is NORMAL for 357 polls (1 poll required for status change)
[10.02.2021 09:00:14] Interface status after poll is NORMAL
[10.02.2021 09:00:14] Finished status poll on interface ether2
[10.02.2021 09:00:14] Starting status poll on interface ether3
[10.02.2021 09:00:14] Current interface status is NORMAL
[10.02.2021 09:00:14] Retrieving interface status from SNMP agent
[10.02.2021 09:00:14] Interface status retrieved from SNMP agent
[10.02.2021 09:00:14] Interface is NORMAL for 357 polls (1 poll required for status change)
[10.02.2021 09:00:14] Interface status after poll is NORMAL
[10.02.2021 09:00:14] Finished status poll on interface ether3
[10.02.2021 09:00:14] Starting status poll on interface ether4
[10.02.2021 09:00:14] Current interface status is NORMAL
[10.02.2021 09:00:14] Retrieving interface status from SNMP agent
[10.02.2021 09:00:14] Interface status retrieved from SNMP agent
[10.02.2021 09:00:14] Interface is NORMAL for 357 polls (1 poll required for status change)
[10.02.2021 09:00:14] Interface status after poll is NORMAL
[10.02.2021 09:00:14] Finished status poll on interface ether4
[10.02.2021 09:00:14] Starting status poll on interface ether5
[10.02.2021 09:00:14] Current interface status is NORMAL
[10.02.2021 09:00:14] Retrieving interface status from SNMP agent
[10.02.2021 09:00:14] Interface status retrieved from SNMP agent
[10.02.2021 09:00:14] Interface is NORMAL for 357 polls (1 poll required for status change)
[10.02.2021 09:00:14] Interface status after poll is NORMAL
[10.02.2021 09:00:14] Finished status poll on interface ether5
[10.02.2021 09:00:14] Starting status poll on interface sfp1
[10.02.2021 09:00:14] Current interface status is NORMAL
[10.02.2021 09:00:14] Retrieving interface status from SNMP agent
[10.02.2021 09:00:14] Interface status retrieved from SNMP agent
[10.02.2021 09:00:14] Interface is NORMAL for 357 polls (1 poll required for status change)
[10.02.2021 09:00:14] Interface status after poll is NORMAL
[10.02.2021 09:00:14] Finished status poll on interface sfp1
[10.02.2021 09:00:14] Starting status poll on interface bridge1
[10.02.2021 09:00:14] Current interface status is NORMAL
[10.02.2021 09:00:14] Retrieving interface status from SNMP agent
[10.02.2021 09:00:14] Interface status retrieved from SNMP agent
[10.02.2021 09:00:14] Interface is NORMAL for 357 polls (1 poll required for status change)
[10.02.2021 09:00:14] Interface status after poll is NORMAL
[10.02.2021 09:00:14] Finished status poll on interface bridge1
[10.02.2021 09:00:14] Node is connected
[10.02.2021 09:00:14] Finished status poll for node Remote-RouterOS RB960PGS-6.40.9
[10.02.2021 09:00:14] Node status after poll is CRITICAL
[10.02.2021 09:00:14] **** Poll completed successfully ****Why would the poll status remain CRITICAL and what can I do to reset it?
-
What's currently in alarms for this node (right click on node -> alarms)?
-
says node down which is weird. on the overview field i can see the ICMP average response time so its getting pings
-
In NetXMS alarms that are present on a node affect node status.
Looks like your EPP does not have a rule to automatically terminate node down alarm when node comes back up (see screenshot of default EPP configuration on that).

-
Thanks for your reply. I would say that it seems to be something there causing the issue (though i've not touched EPP AFAIK) but as soon as I remove one of these alarms it does show as up
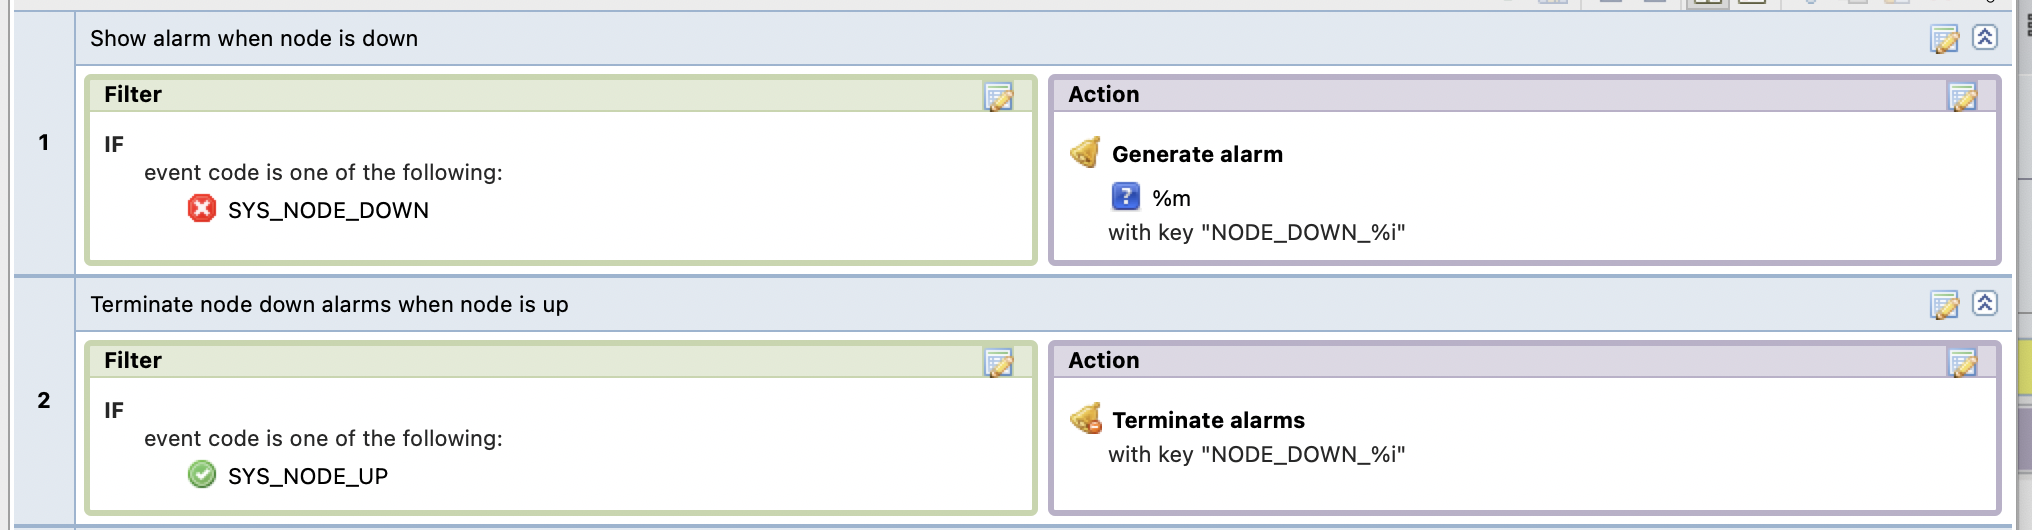
-
Try checking alarm log (View -> Alarm log) to see what was happening - what was the event that triggered the alarm and what is the alarm key.
-
I have the same problem with nodes remaining down (no VPN involved though).
Node down/up works fine for all hosts monitored on the internal IP subnet, but for the ones that use public IPs (still with the agent), they remain down.
I have this node for example, that is reachable, polling its status looks ok:
[08.12.2021 11:46:38] **** Poll request sent to server ****
[08.12.2021 11:46:38] Poll request accepted
[08.12.2021 11:46:38] Starting status poll for node Dolion
[08.12.2021 11:46:38] Checking NetXMS agent connectivity
[08.12.2021 11:46:38] Starting status poll on interface lo
[08.12.2021 11:46:38] Current interface status is NORMAL
[08.12.2021 11:46:38] Retrieving interface status from NetXMS agent
[08.12.2021 11:46:39] Interface status retrieved from NetXMS agent
[08.12.2021 11:46:39] Interface is NORMAL for 790 polls (1 poll required for status change)
[08.12.2021 11:46:39] Interface status after poll is NORMAL
[08.12.2021 11:46:39] Finished status poll on interface lo
[08.12.2021 11:46:39] Starting status poll on interface eno1
[08.12.2021 11:46:39] Current interface status is NORMAL
[08.12.2021 11:46:39] Retrieving interface status from NetXMS agent
[08.12.2021 11:46:39] Interface status retrieved from NetXMS agent
[08.12.2021 11:46:39] Interface is NORMAL for 790 polls (1 poll required for status change)
[08.12.2021 11:46:39] Interface status after poll is NORMAL
[08.12.2021 11:46:39] Finished status poll on interface eno1
[08.12.2021 11:46:39] Starting status poll on interface eno2
[08.12.2021 11:46:39] Current interface status is DISABLED
[08.12.2021 11:46:39] Retrieving interface status from NetXMS agent
[08.12.2021 11:46:39] Interface status retrieved from NetXMS agent
[08.12.2021 11:46:39] Interface is DISABLED for 754 polls (1 poll required for status change)
[08.12.2021 11:46:39] Interface status after poll is DISABLED
[08.12.2021 11:46:39] Finished status poll on interface eno2
[08.12.2021 11:46:39] Starting status poll on interface enp0s20f0u8u3c2
[08.12.2021 11:46:40] Current interface status is DISABLED
[08.12.2021 11:46:40] Retrieving interface status from NetXMS agent
[08.12.2021 11:46:40] Interface status retrieved from NetXMS agent
[08.12.2021 11:46:40] Interface is DISABLED for 754 polls (1 poll required for status change)
[08.12.2021 11:46:40] Interface status after poll is DISABLED
[08.12.2021 11:46:40] Finished status poll on interface enp0s20f0u8u3c2
[08.12.2021 11:46:40] Node is connected
[08.12.2021 11:46:41] Finished status poll for node Dolion
[08.12.2021 11:46:41] Node status after poll is CRITICAL
[08.12.2021 11:46:41] **** Poll completed successfully ****Any idea how to fix this?
-
For this node:
- does it has any alarms?
- does it has any interfaces in critical state?
-
-
So I believe the interfaces are keeping the node in critical. What happened when you tried to set them to "Ignore"? Some error message? SQL error messages in server log? What if you delete these interfaces and do configuration poll - is it possible to edit them then?
-
-
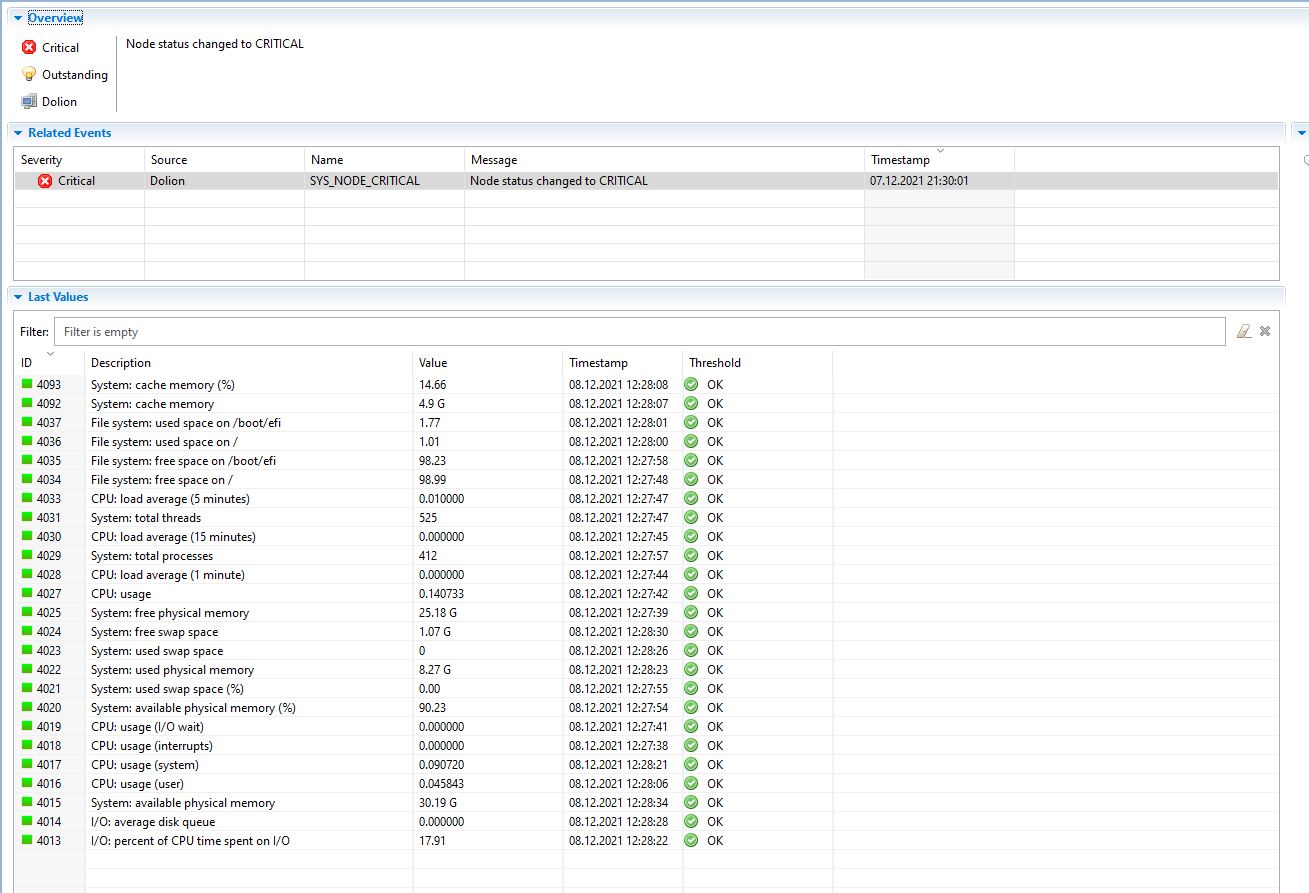
I have termianted manually the alarm, and things look ok. I did this to make sure I get alarms in case something happens with that box, but the issue is still there

status poll shows the node Normal now:
[09.12.2021 17:11:14] Node is connected
[09.12.2021 17:11:15] Finished status poll for node Dolion
[09.12.2021 17:11:15] Node status after poll is NORMAL
[09.12.2021 17:11:15] **** Poll completed successfully ****
Hello! It looks like you're interested in this conversation, but you don't have an account yet.
Getting fed up of having to scroll through the same posts each visit? When you register for an account, you'll always come back to exactly where you were before, and choose to be notified of new replies (either via email, or push notification). You'll also be able to save bookmarks and upvote posts to show your appreciation to other community members.
With your input, this post could be even better 💗
Register Login