
Netxms-Server crashes after tuning
-
Hello,
I have a problem with the correct tuning of the server.
We use version 3.8.193 of the netxms-server, database is postgresql 11.11 with timescaledb.
The whole thing is set up as a cluster (2 nodes), as described here in the forum (pacemaker, corosync), under ESX.
Each VM has 8 CPUs and 16 GB RAM, storage (flash) is connected via SAN, the network has 10 Gbit.Without (or moderate) tuning, the CPU-load is approx. 1,6.
However, the threads, mostly POLLERS, are completely overloaded:POLLERS Threads.............. 500 (250/500) Load average......... 4006.09 4004.16 4002.81 Current load......... 801% Usage................ 100% Active requests...... 4005 Scheduled requests... 0 Total requests....... 2991207 Thread starts........ 250 Thread stops......... 0 Average wait time.... 13489521 msIf I adjust the configuration, e.g. ThreadPool.Poller.MaxSize = 4000 and so on, the load is significantly reduced.
However, after some time (minutes, hours, days) the CPU-load increases to 300 or more and the service is terminated, systemctl says netxms-server aborted.Here the stats:
Objects............: 39878
Monitored nodes....: 4050
Collectible DCIs...: 26354
Active alarms......: 970
Uptime.............: 27 days,  4:16:28
Approx. 1100 of these are network devices that are queried via SNMP. To reduce the load, the topology query is deactivated for these.
700 are server (with agent), the rest of the devices, with a few exceptions, are monitored via PING.The network devices are polled via proxy, other devices are connected directly to the server.
I have returned to a working configuration (with slow pollers and data collection), but would like to know how I can optimise the system.
Unfortunately I don't have any logs from the last crash, is there any other information that helps to solve the problem?I would appreciate any tips on how to make the system more reliable.
Andi
-
We had a similar challenge with the poller queue never "catching up" and would continue to grow.
Victor took a closer look. Turning on parallel processing and increasing the Discovery.BaseSize from 1 to 8 seems to have helped immensely. We haven't had any related problems since.
Not sure if this will help your situation.
-zeb
-
Hi,
most likely you have hit RAM limit when allow thread pool to grow to 4000 threads. Could also be other memory-related issue (memory leak in server, slow database causing DB writer queues to grow, etc. Do you have pre-crash data on number of threads, queues, and memory consumption?
Also, 4000 nodes is not that much, it is quite strange that 500 threads is not enough. Such high load on poller pool indicates that there are lot of polls taking long time to complete. Could it be that you have many nodes that timeout when polled?
Best regards,
Victor -
Hello,
unfortunately, it took some time until I could deal with the topic again.
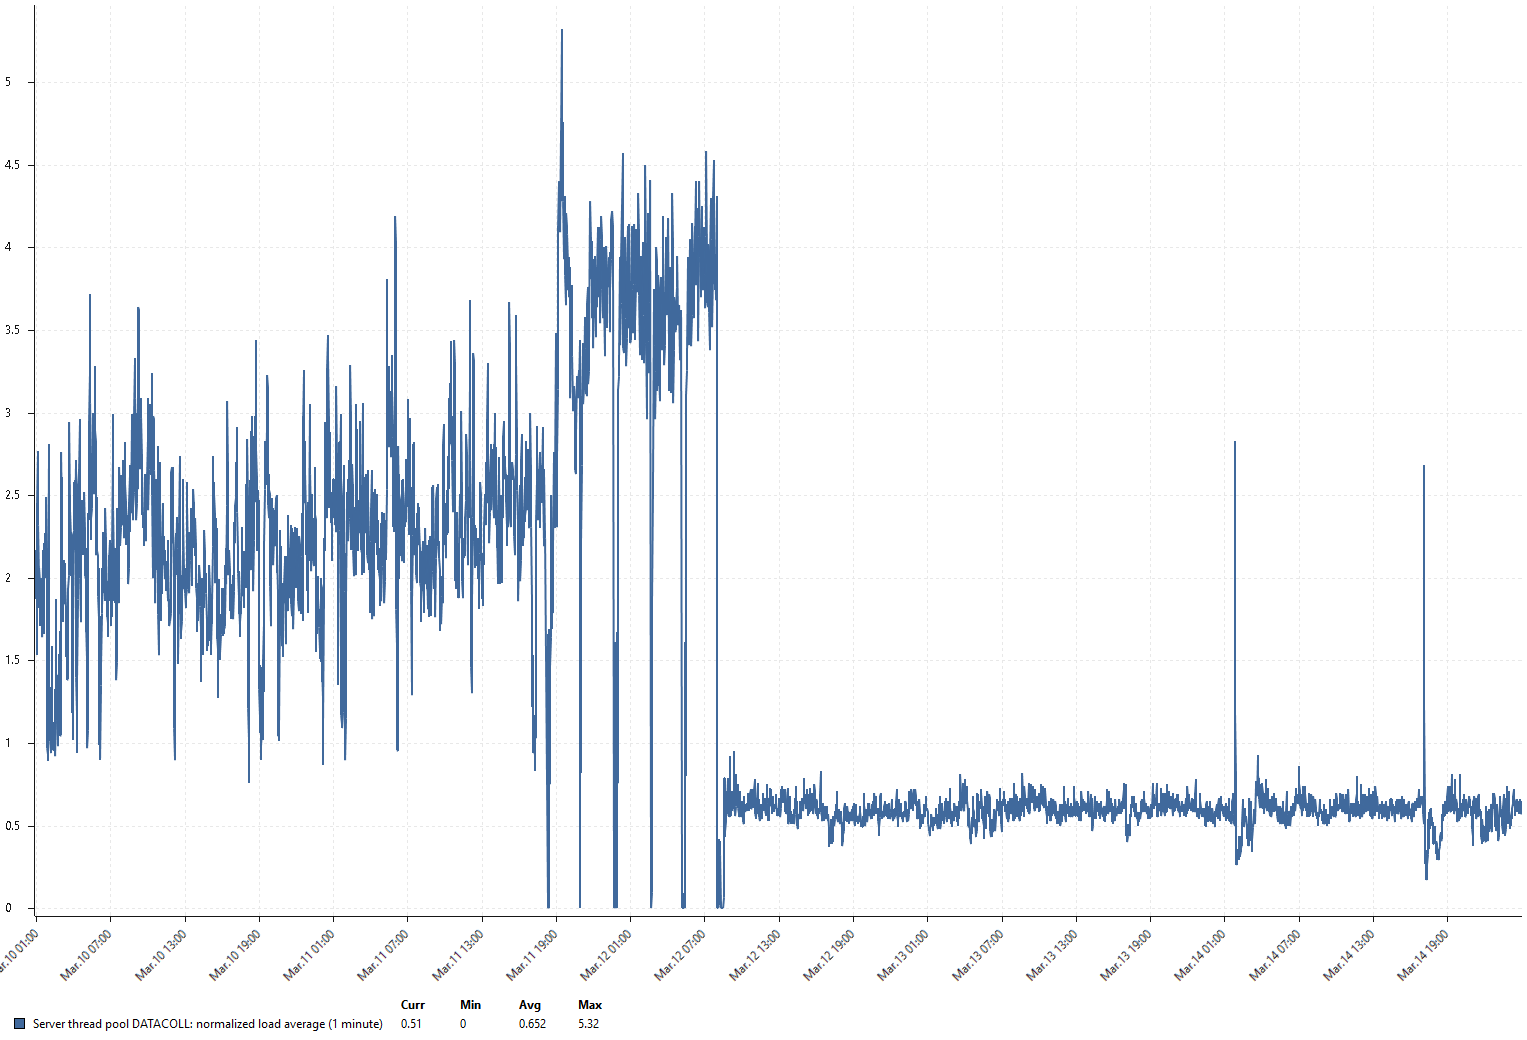
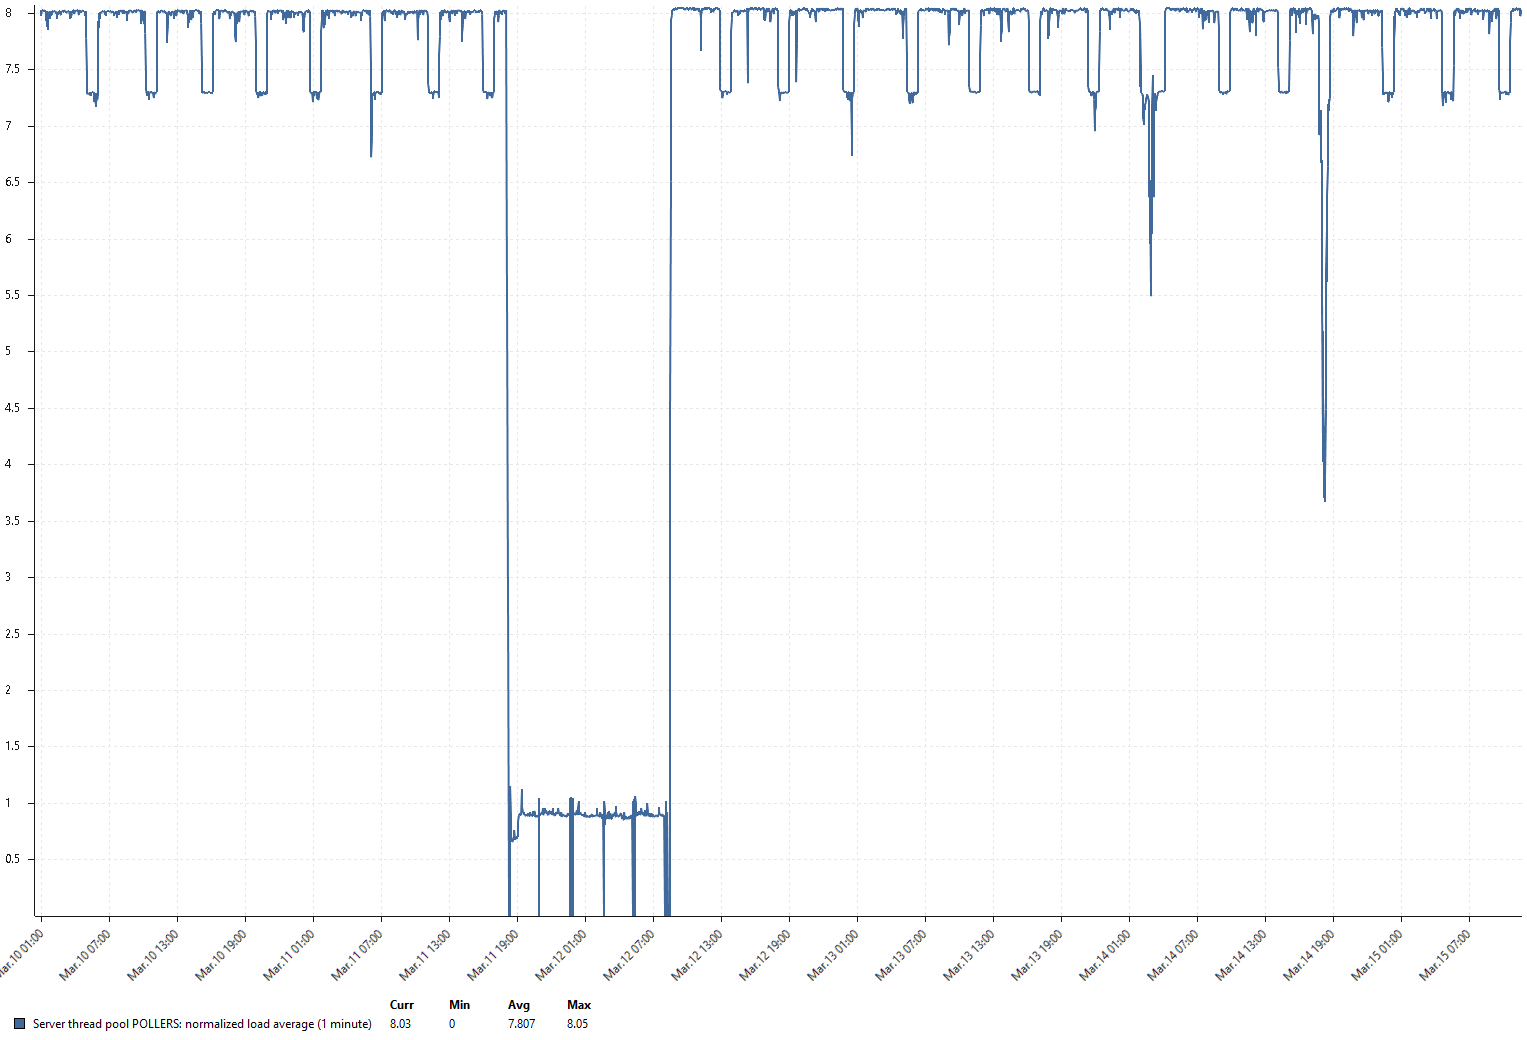
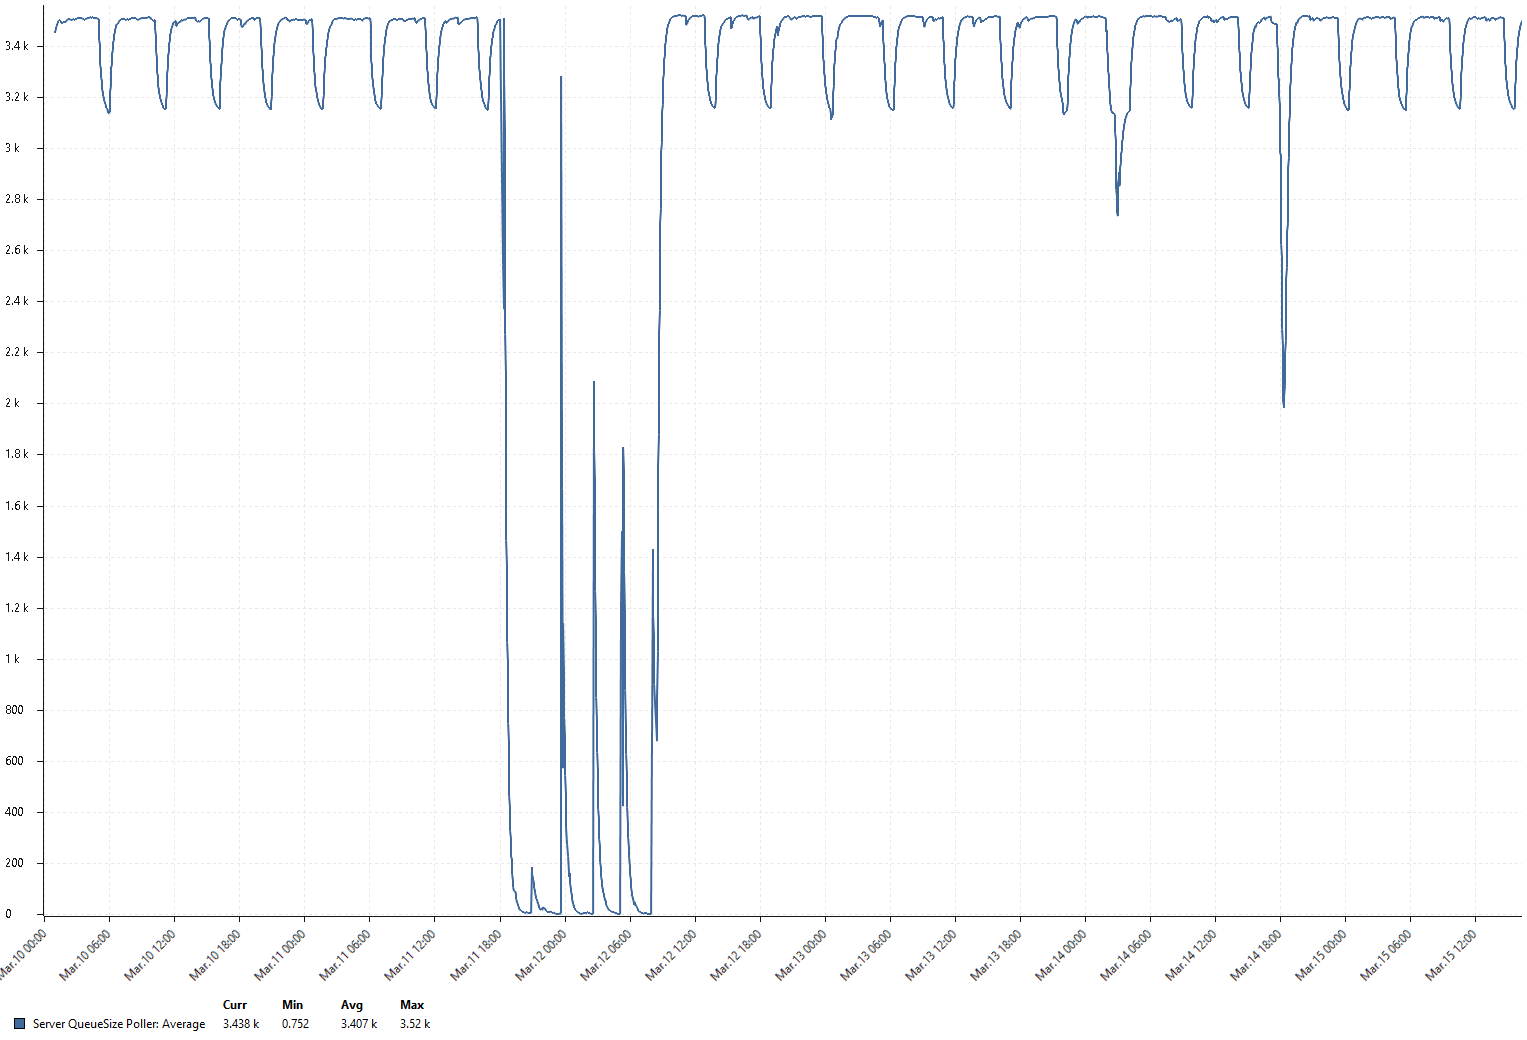
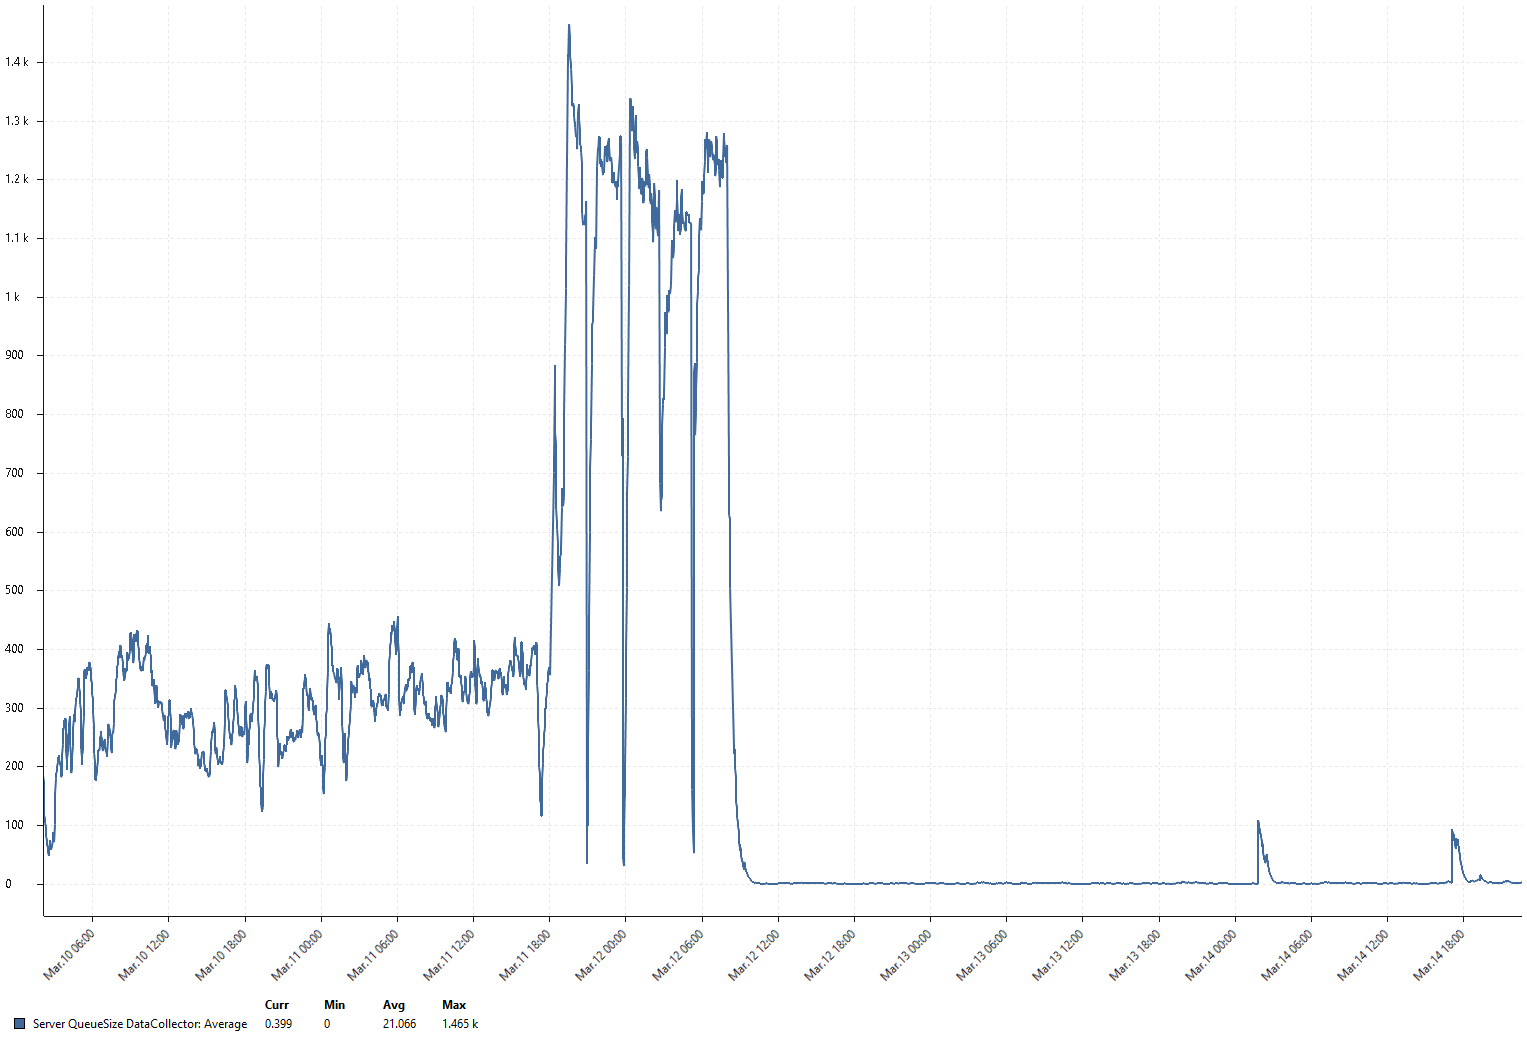
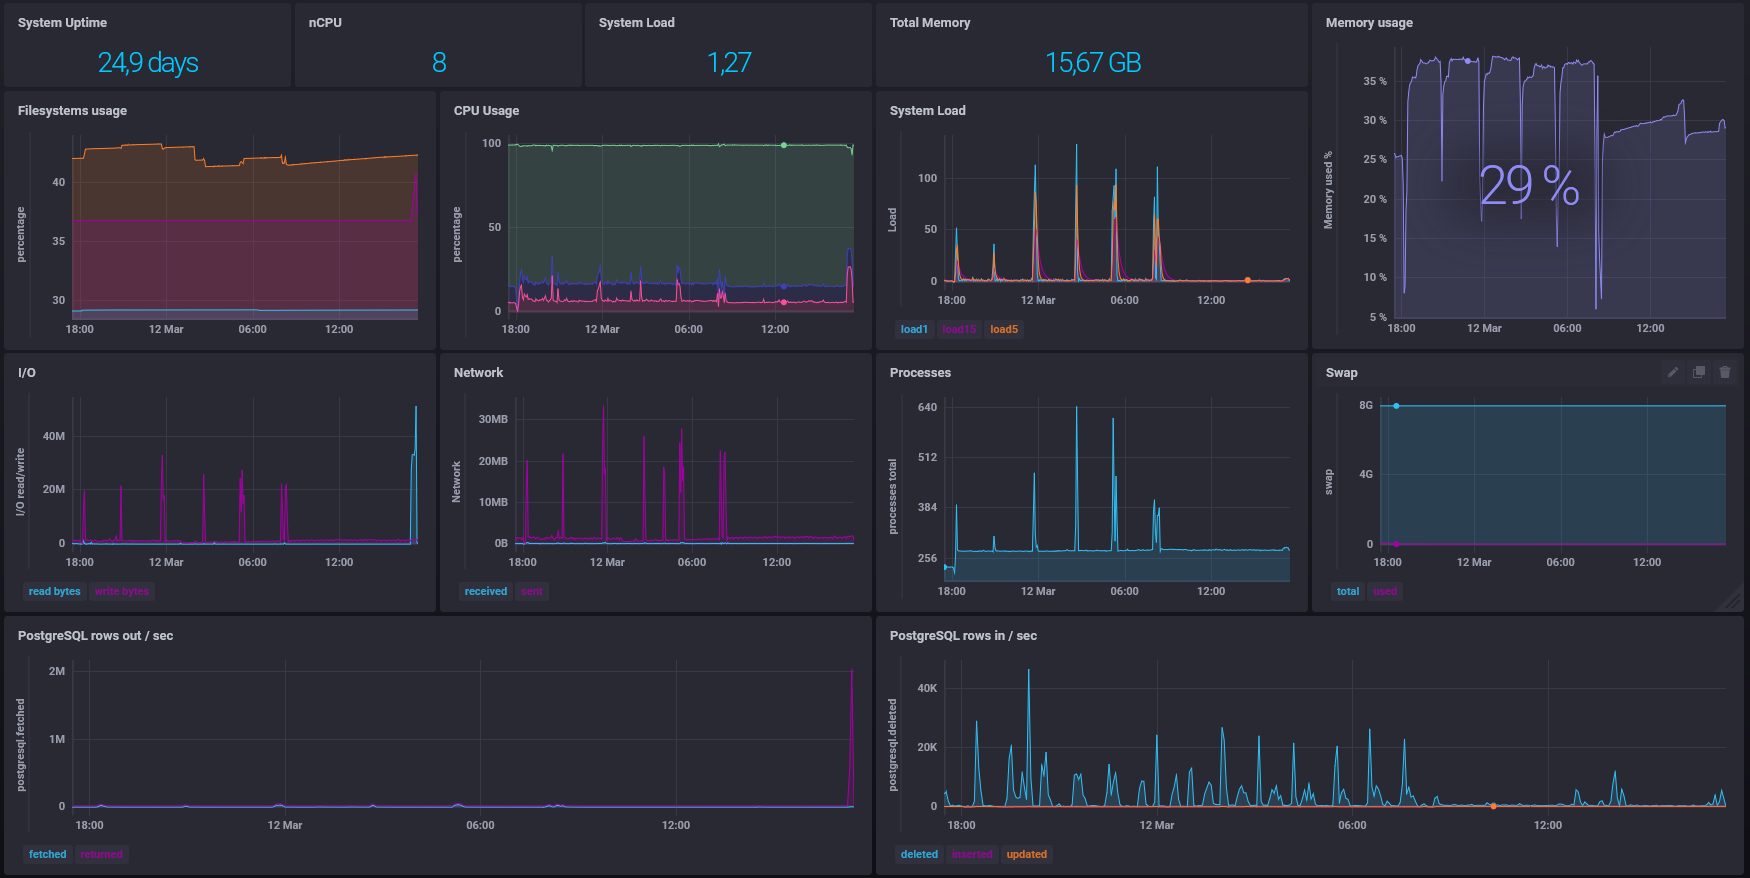
The memory usage looks OK to me, how do you recognise a slow database? At least I don't see anything in the associated logs.Attached are a few graphics, on 11 March at 18:00 I started the server with tuned values. During the night the service stops several times, but is restarted by corosync. In the morning of 12 March, I restore the default values.
Are there any values that I should look at more closely? Or which I should monitor before the next tuning attempt? Unfortunately, the tuning topic is described somewhat briefly in the documentation, and the designations no longer seem to be correct.
Andi
-
Hi,
problem is definitely with pollers pool usage, rest looks fine. I would suggest gradually increasing size of pollers pool, probably start with 750/1500 from current 250/500.
Do you use hook scripts?
Do you have routers with huge routing tables? If yes, you could try to disable routing table poll for such devices.
If netxmsd is crashing, does system generates core file? If sould be really helpful for debugging the issue.
Best regards,
Victor -
Thanks Victor,
I will test the suggested values.
In fact, we have some adjustements in Hook::ConfigurationPoll. We set the interface expected state there depending on the name and CDP/LLDP. Is this a problem?
We also have a core network with large routing tables, but these are already deactivated. But it would be nice to be able to use them.
Core dump is not active yet, but I will switch it on. I can also try running the service with dbg to debug the crash.
Many thanks once again
Andi -
Hello everybody,
I have now tried several times to tune the server, but I can't get any further.
After some time, the service stops and restarts, so a practical use is not possible.I now have a few core files, should I upload them?
Thanks
-
Hi,
please use this link for upload: https://cloud.radensolutions.com/s/88sd5KwD2SaAewE
Best regards,
Victor -
Hi Victor,
I just uploaded an actual core-dump, name is "core_20210523".
Thanks
-
Hello,
today the server crashed again for no apparent reason. The only explanation would be that a vMotion took place in ESX 30 minutes before.
Could this be the problem?
Thanks
-
Okay,
unfortunately, the server can no longer be started, even with default values.
Even when I load a dump on the test server and try it there, the server stops after a few minutes.Is there a possibility to get support for this? We had planned to buy support for next year, maybe we can buy it earlier.
Thanks
-
Hello,
yes, it's possible. I can take a look tomorrow at your server. Will send you PM with contact details.
Best regards,
Victor
Hello! It looks like you're interested in this conversation, but you don't have an account yet.
Getting fed up of having to scroll through the same posts each visit? When you register for an account, you'll always come back to exactly where you were before, and choose to be notified of new replies (either via email, or push notification). You'll also be able to save bookmarks and upvote posts to show your appreciation to other community members.
With your input, this post could be even better 💗
Register Login