Skip to content
  • Categories
  • Recent
  • Tags
  • Popular
  • Users
  • Groups
Skins
  • Light
  • Brite
  • Cerulean
  • Cosmo
  • Flatly
  • Journal
  • Litera
  • Lumen
  • Lux
  • Materia
  • Minty
  • Morph
  • Pulse
  • Sandstone
  • Simplex
  • Sketchy
  • Spacelab
  • United
  • Yeti
  • Zephyr
  • Dark
  • Cyborg
  • Darkly
  • Quartz
  • Slate
  • Solar
  • Superhero
  • Vapor

  • Default (Flatly)
  • No Skin
Collapse
Brand Logo

NetXMS Forum

  1. Home
  2. Support
  3. Graphing differences between samples IfErrors/IfOctets

Graphing differences between samples IfErrors/IfOctets

Scheduled Pinned Locked Moved Support
5 Posts 2 Posters 39.1k Views
  • Oldest to Newest
  • Newest to Oldest
  • Most Votes
Reply
  • Reply as topic
Log in to reply
This topic has been deleted. Only users with topic management privileges can see it.
  • A
    A
    Azur
    wrote on last edited by
    #1

    Hello everyone,

    I am trying to monitor a switch using IfInError, IfOutError, IfInOctets and IfOutOctets. I have successfully configured the MiB variables for this and created graphs, but what I would like to accomplish now is to change the graph's Y axis or the layout of the entire graph, so that I can monitor the changes happening every minute or so.

    How can I accomplish this, all ideas are welcome ?

    In the picture attached, you can see the current graph I have.

    Thank you very much in advance,
    Azur
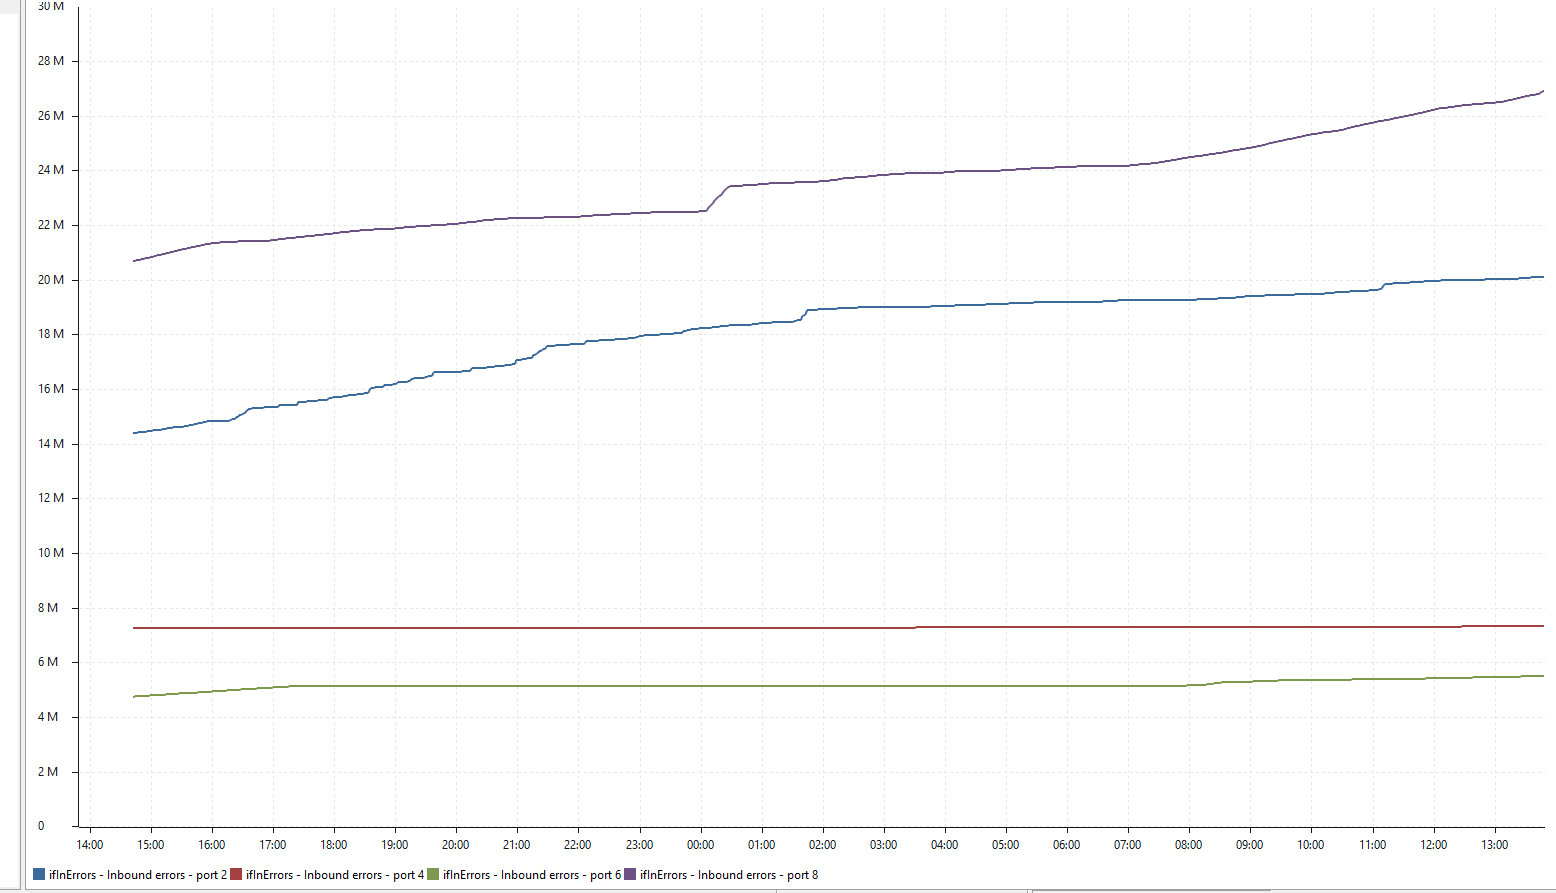

    Screenshot 2022-05-31 at 13.48.39.png

    1 Reply Last reply
    0
    • F
      F
      Filipp Sudanov
      wrote on last edited by
      #2

      You can use delta in the settings of the DCIs - in this case you will have number of events par minute for example.

      1 Reply Last reply
      0
      • A
        A
        Azur
        wrote on last edited by
        #3

        Hi Filipp,

        I do not seem to find such option. In guide I can see that this is reachable through a properties window that I can not seem to reach.
        Could you please help how to reach this ?

        Thank you,
        Azur

        1 Reply Last reply
        0
        • F
          F
          Filipp Sudanov
          wrote on last edited by
          #4

          That would be in "Data collection configuration" of a node where this data is collected from.
          In properties of data collection item select Transformation tab and choose Average delta per minute.

          1 Reply Last reply
          0
          • A
            A
            Azur
            wrote on last edited by
            #5

            Oh.. I was right clicking the items not double clicking previously. That is why I could not find those. :-X

            Thank you very much Filipp.
            Best regards.
            Azur

            1 Reply Last reply
            0

            Hello! It looks like you're interested in this conversation, but you don't have an account yet.

            Getting fed up of having to scroll through the same posts each visit? When you register for an account, you'll always come back to exactly where you were before, and choose to be notified of new replies (either via email, or push notification). You'll also be able to save bookmarks and upvote posts to show your appreciation to other community members.

            With your input, this post could be even better 💗

            Register Login
            Reply
            • Reply as topic
            Log in to reply
            • Oldest to Newest
            • Newest to Oldest
            • Most Votes


            • Login

            • Don't have an account? Register

            • Login or register to search.
            Powered by NodeBB Contributors
            • First post
              Last post
            0
            • Categories
            • Recent
            • Tags
            • Popular
            • Users
            • Groups