
Using Web API to retrieve NetXMS Alarm data in Grafana
-
Hi
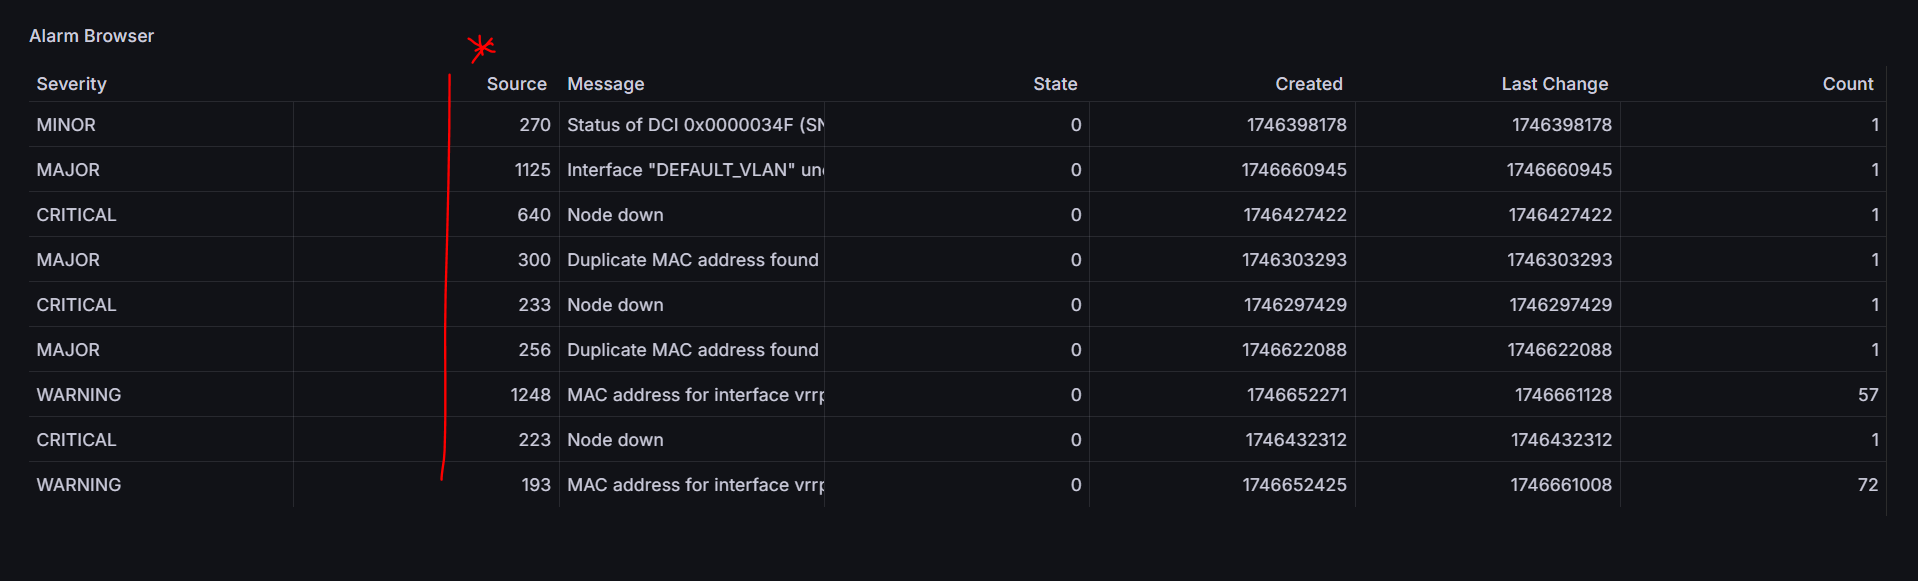
Am trying to replicate this dashboard https://netxms.org/documentation/adminguide/_images/grafana-alarm-browser.png by making API calls. Am able to get some data in but I cant see any API that retrieves the node name. All I see is the object ID as seen below. Is there a way to get it to show the actual device name and not just ID. This is my API http://x.x.x.x:8080/webapi/alarms
-
Hi,
There are two options.Our old Grafara plugin had it's own data point (that is still present and works):
/grafana/alarms
Call examples:
/grafana/alarms - gives object id to object name
/grafana/alarms?targets=[{}] - will return all alarms
grafana/alarms?targets=[{"alarmSource":{"id":108}}] - to get alarms for object with id 108
You can add as many elements with required object ids in array needed: [{"alarmSource":{"id":108}}, {"alarmSource":{"id":512}}, ...]
Another option is to add parameter resolveReferences=true to webapi/alarms request like: http://x.x.x.x:8080/webapi/alarms?resolveReferences=true
This parameter adds full information about alarm source node, source event name and names of users if possible to resolve. -
-
First endpoint also just works without Grafana plugin (it just provides data in human readable way).
-
-
@zev said in Using Web API to retrieve NetXMS Alarm data in Grafana:
First endpoint also just works without Grafana plugin (it just provides data in human readable way).
Thank you for the support Tatjana Dubrovica. I have successfully retrieved the Alarms via API on grafana. I was wondering if I can do same to retrieve the following via API. Are there limitations? I cant find any clue on the API documentations.
- DCI
- Status Map
- Device interfaces as it is on NetXMS UI and hardware inventory
- Maps - the nice map showing real time statistics of link and interface states
If not supported via API, can it be done by querying the postgres database directly?
-
Hi. Happy that I helped you.
For DCI data please check this request:
https://netxms.org/documentation/adminguide/rest-api.html#dci-valuesThis is my example of configuration:
URL: http://10.5.5.111:8000/v1/objects/108/data-collection/183/history
UTL query params:
timeFrom $__from/1000
timeTo $__to/1000
Root: valuesFor status map I'm not sure how it can be created with help Ifinity plugin but check API that returns array with objects: https://netxms.org/documentation/adminguide/rest-api.html#get-multiple-objects-with-filters
The only option for maps as for now is to create link in NetXMS that afterwards will be used in IFrame plugin to insert it to the dashboard.
-
There is new blog post about Grafana/NetXMS integration. Maybe object queries might help you with interface display options.
Post:
https://netxms.com/blog/grafana-configuraiton-in-netxms -
@zev said in Using Web API to retrieve NetXMS Alarm data in Grafana:
There is new blog post about Grafana/NetXMS integration. Maybe object queries might help you with interface display options.
Post:
https://netxms.com/blog/grafana-configuraiton-in-netxmsWow, Wow..Thank you so much Tatjana Dubrovica. This is a life saver. I have struggled working with infinity plugin to get all the things I want. Though I have made a little progress, the blog post provides a lot more granular insight. I really do appreciate this..

Hello! It looks like you're interested in this conversation, but you don't have an account yet.
Getting fed up of having to scroll through the same posts each visit? When you register for an account, you'll always come back to exactly where you were before, and choose to be notified of new replies (either via email, or push notification). You'll also be able to save bookmarks and upvote posts to show your appreciation to other community members.
With your input, this post could be even better 💗
Register Login