Hi!
FYI 1:
we're preparing some kind of pilot installation for the company I'm working for.
After an initial evaluation phase we decided within the team to propose NetXMS as the data/metric gathering & evaluation engine.
If it is accepted or not, will depend on our domain architects.
FYI 2:
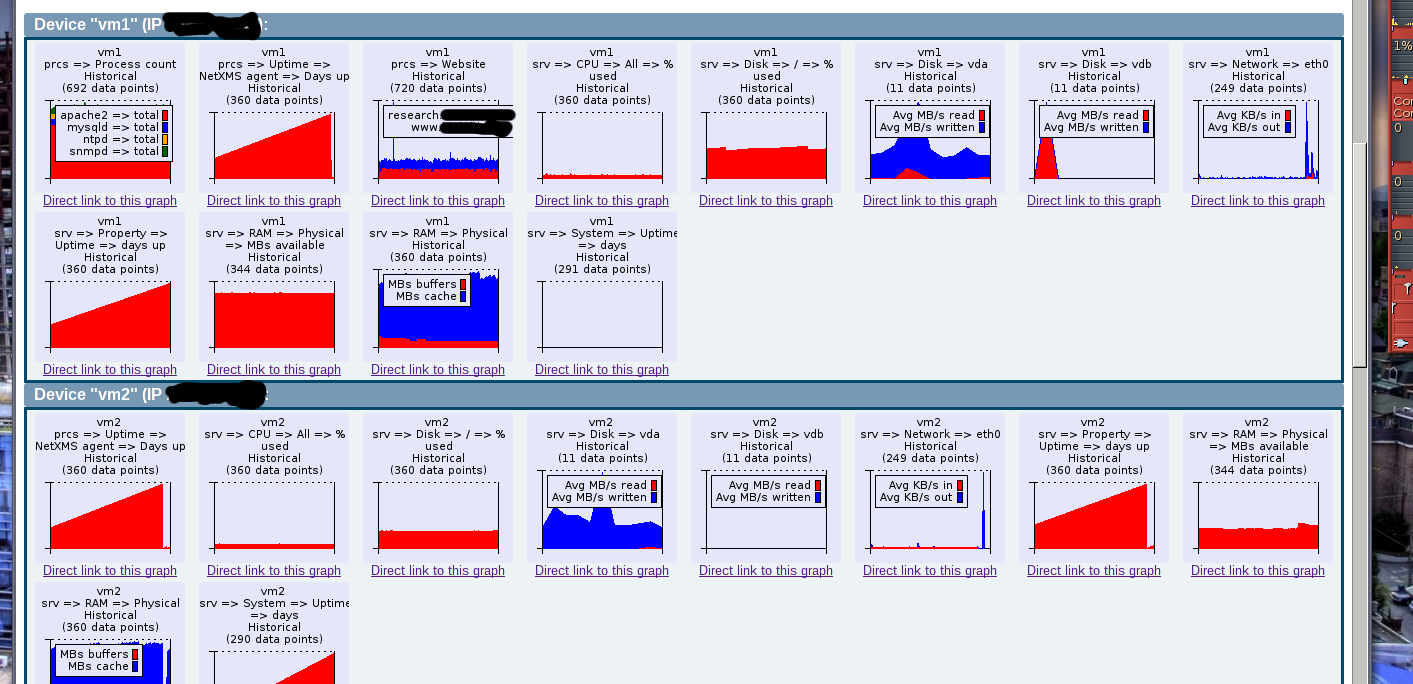
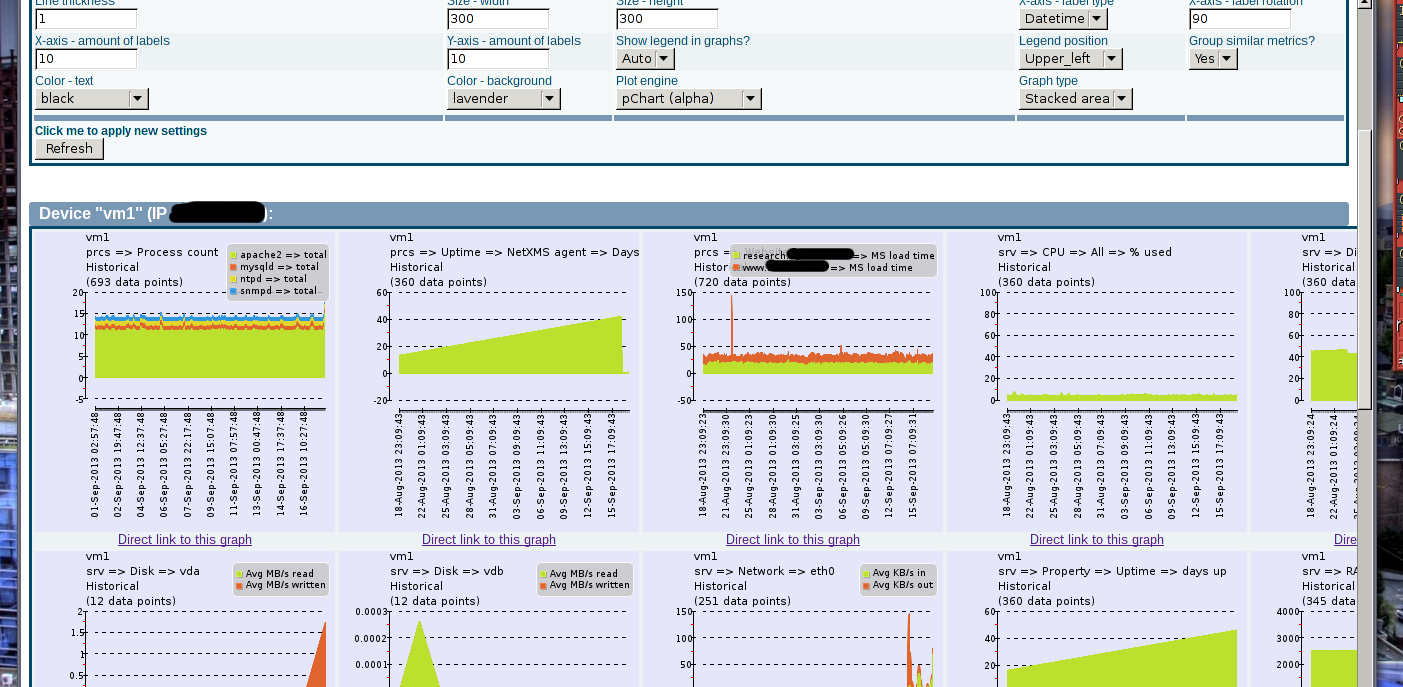
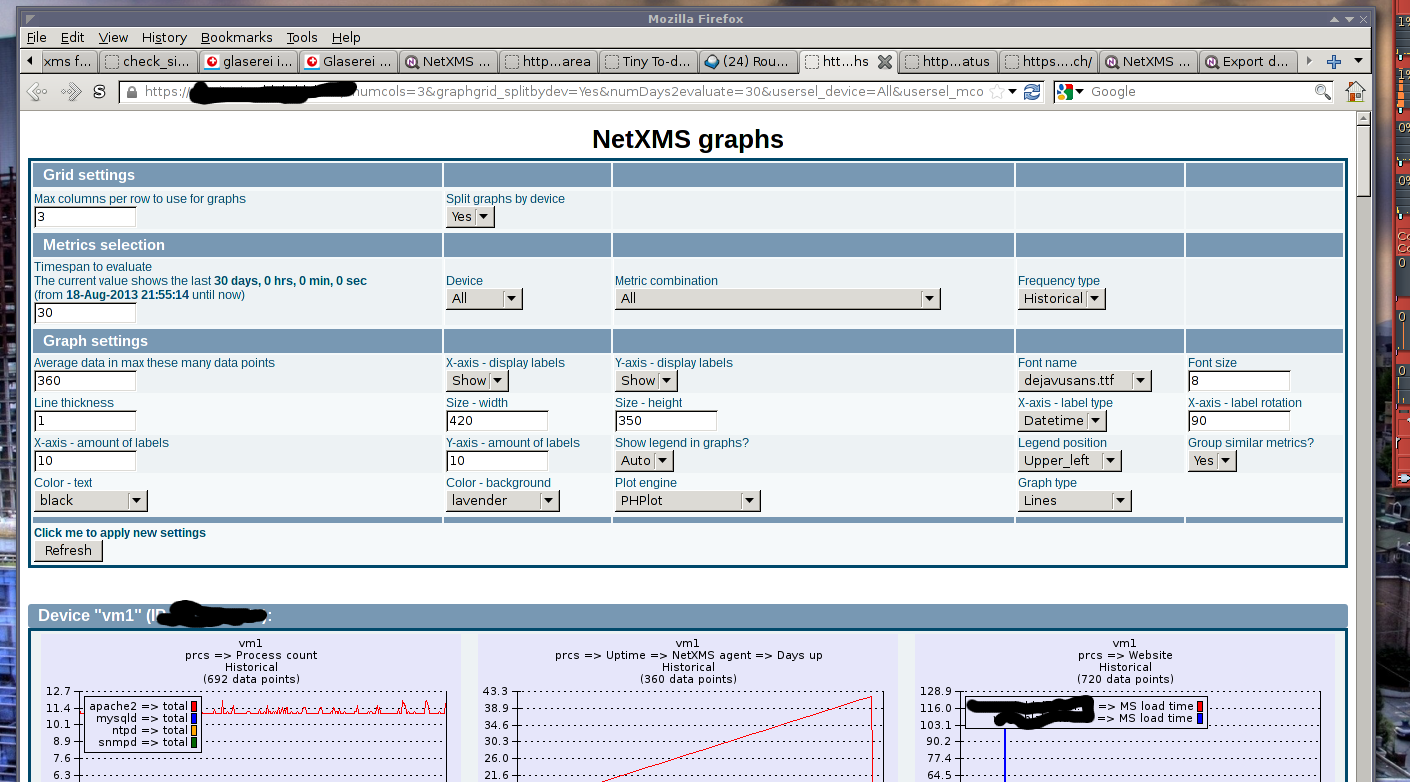
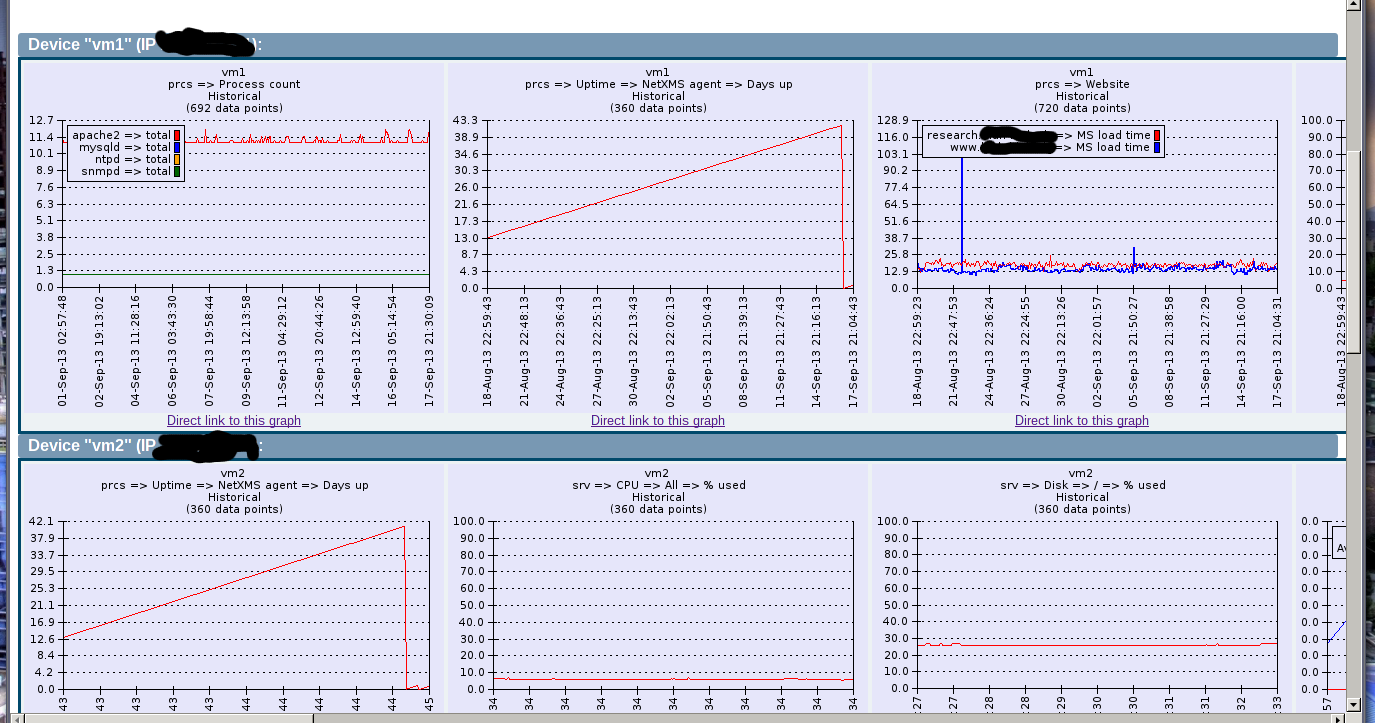
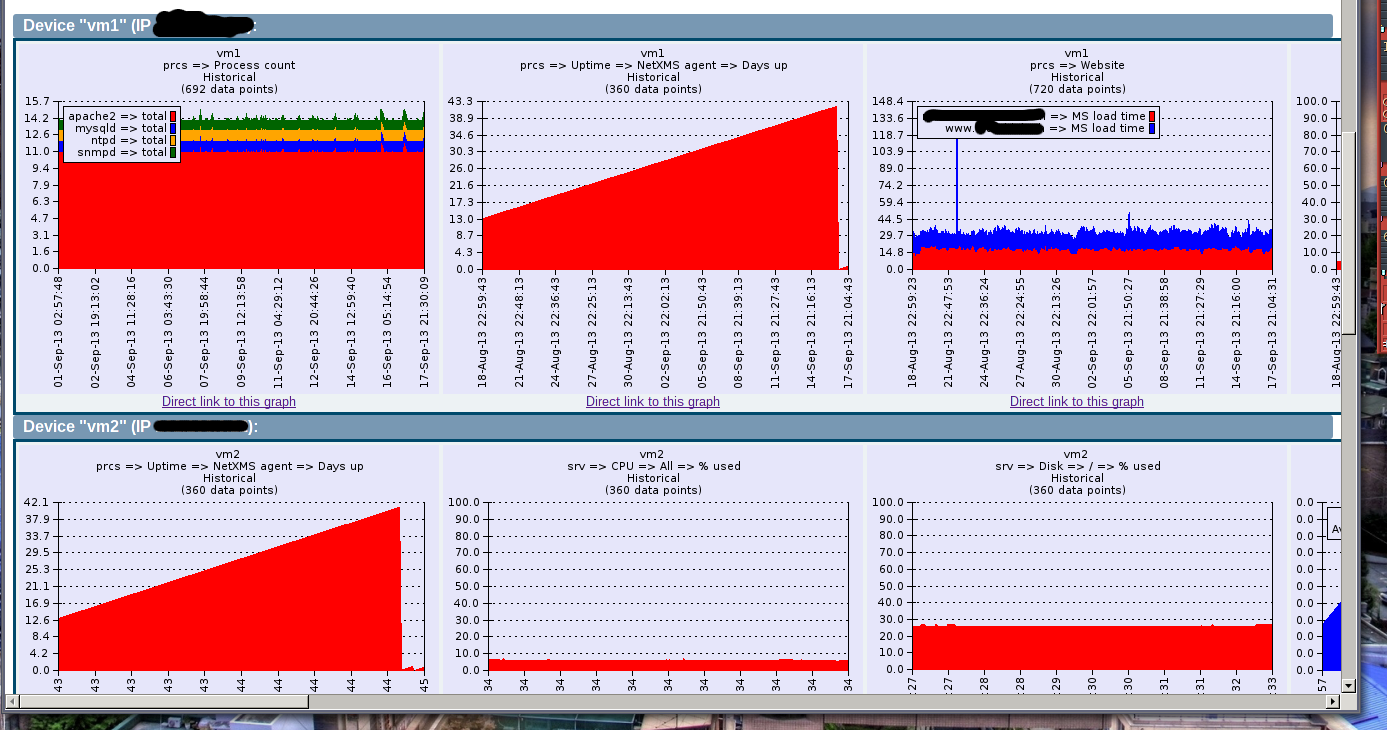
To present the data to the user in the form of graphs or status indicators we decided not to use NetXMS' Dashboard but to write a custom PHP frontend (which might use multiple PHP and js graph engines which would be selectable by the user through parameters on the custom PHP webpage, depending on how the user would want to see the output - we initially thought about using "Graphite", which worked very well privately, but it's just too hard to install its dependencies in a strictly controlled enterprise environment).
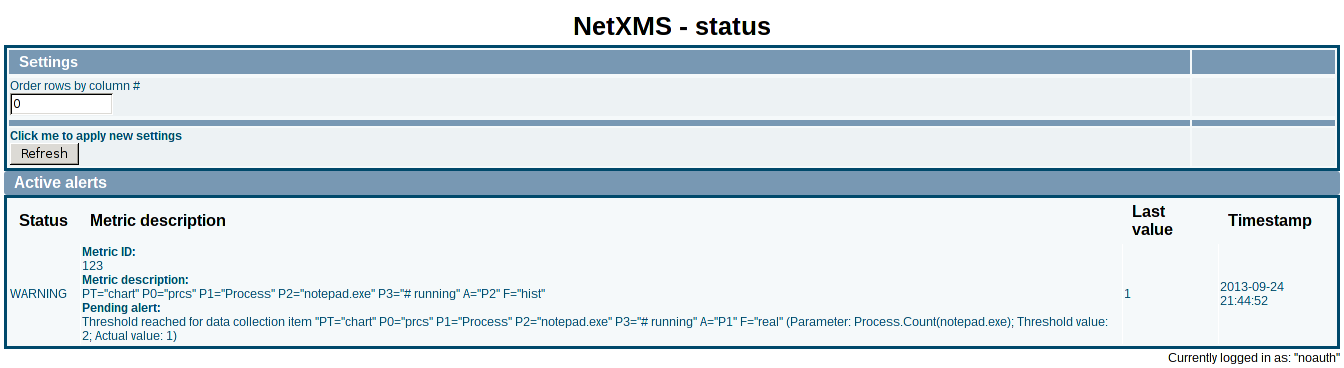
Theoretically the configuration about how the graphs are presented on the webpage(s) (which graphs show up on which webpage, which statistics are shown in the same graph, etc...) would be done by specifying options in a long hierarchy-like text-string in the "Description" field of the NetXMS Data Collector (which, if I'm right, can be 256 chars long).
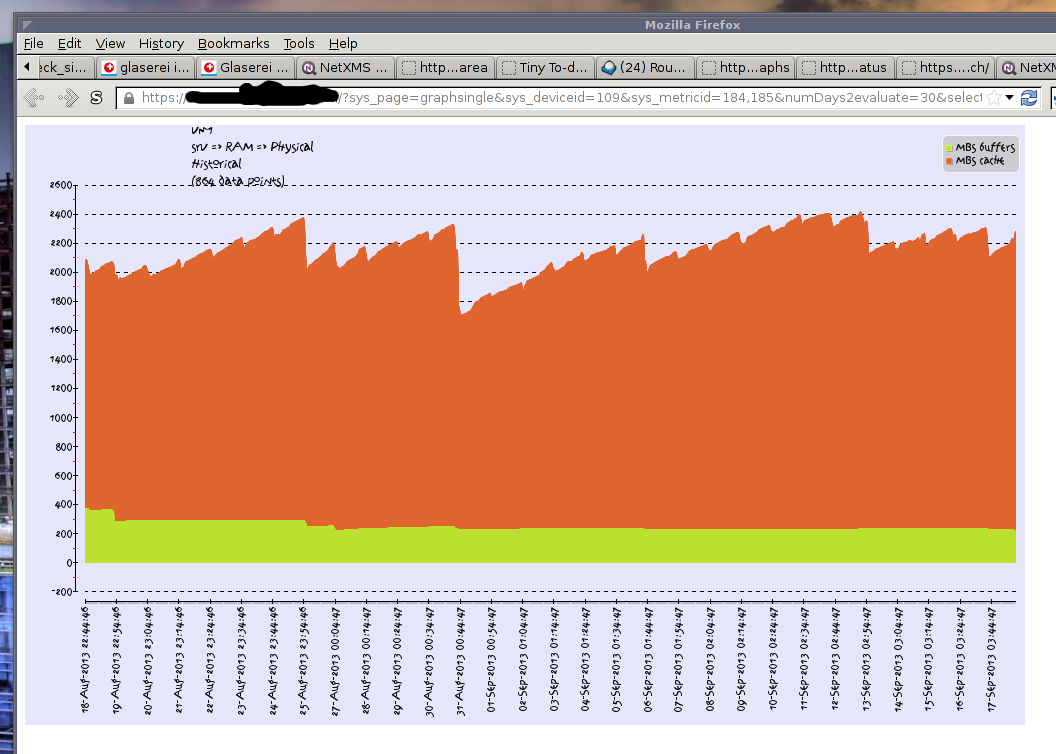
We're currently working on the second part (10% progress until now - just able to display a single graph for a single metric on a single page), and it will take a while until we're able to generate something more complex
The current priority of the DB-backends SQLs is towards Oracle and SQLite, where Oracle will get the highest priority.
I'll post here some updates if anything crucial happens and especially to ask you what you think about the result if we manage to put together something usable.
So please, don't do any crazy changes to the base concepts & DB-layout, otherwise I'll have to rewrite all the SQLs and rethink about the whole approach! 
Cheers