
+1
C
ChrisC
@ChrisC
Posts
-
ModBus TCP/IP -
Can someone explain how Geographical Areas work?I'm trying to add some locations for our devices, and I can't find any instructions for Configuation -> Geographical Areas
I've tried adding in coordinates, one per line, which just results in error saying "Cannot parse area border point".
When I try and import a .kml file, nothing happens.How am I supposed to use this function?
Thanks,
-
Is counting TCP connections without using Agent possible?Thank you.
This Manual page helped immensely: https://wiki.netxms.org/wiki/NXSL:SNMPWalkThe following works perfectly:
// Call this function with the following parameters: // $1 = port number (eg 5900 for VNC) // $2 = IP address (xxx.xxx.xxx.xxx) transport = CreateSNMPTransport($node); if (transport == null) return -1; oid = ".1.3.6.1.2.1.6.13.1.4." . $2 . "." . $1 ; // IP connections vars = SNMPWalk(transport, oid); if (vars == null) return -2; // SNMPWalk failed count = 0; foreach (v: vars) { //trace(1, "SNMP WALK ".v->name."=".v->value); count = count +1; } return count; -
Is counting TCP connections without using Agent possible?https://www.netxms.org/forum/general-support/how-to-countgraphcheck-tcp-connection-states-table-with-netxms/msg2031/#msg2031 nicely explains how to do it using the Agent, but I was wondering if there is a way of counting OIDs that match a certain criteria without having to have an Agent installed, as some of this is available via SNMP.
For example, OID:
.1.3.6.1.2.1.6.13.1.4.xxx.xxx.xxx.xxx.ssss.yyy.yyy.yyy.yyy.ddddxxx.xxx.xxx.xxx is the local IP address, and ssss is the local port.
yyy.yyy.yyy.yyy is the remote IP address, and dddd is the remote port.
If I could count the number of times ".1.3.6.1.2.1.6.13.1.4.xxx.xxx.xxx.xxx.ssss.*" appears in the list, I could count how many connections there are to a specific service.Is this possible somehow?
-
Centralized Agent Upgrade FailsThanks Filipp!
I'll try it out. -
Sharing Standard Templates for NetXMSVMWare Memory, CPU and Storage
Don't ask about other values (IOPS, latency etc), as I haven't figured it out yet, and may require PowerCLI or something annoying
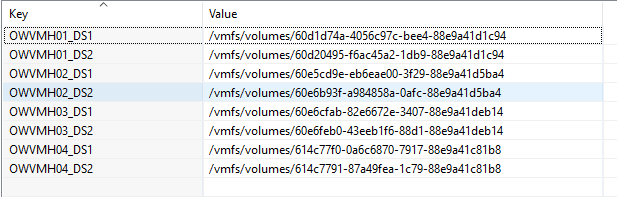
See attached screenshots for examples.
To make things easier, add the datastore names as persistant storage keys and values.
You can then reference them in the scripts using the name rather than the annoyingly long mount points. Of course there's no easy way of finding out this in the first place, other than SSHing into the server and doing a "df", or looking in the vCenter DataStore sections. Datastore names are not queryable via SNMP as far as I can tell, which is lame.The template should auto apply, but once they have applied to your servers, you will need to add some DCIs manually using the included scripts to correctly deal with the datastores.
ThegetVMWareCPULoad(totalCPUUsage)is used to monitor total CPU usage for all cores, as with most VMWare servers, graphing individual CPUs will probably end up with a crazy graph with mainly black lines unless you can be bothered to find 32 different colours for your 32 cores
getVMWareCPULoadwill add up CPU usage from each core, and using
getVMWareCPULoad(totalCPUCountX100)can be used to get a line to show if all cores were using 100%.Hopefully this is useful. If you have any suggestions on how to add more useful metrics, please let me know!
Thanks

-
Network monitoringThey may be old, but they are still useful. I watched them all to get an idea of how NetXMS worked....
-
Centralized Agent Upgrade FailsI have followed the instructions here:
https://www.netxms.org/documentation/adminguide/upgrade.html?highlight=upgrade agent#centralized-agent-upgrade, but when I try and deploy the agent, none of them work, and I get the message "Agent's version doesn't match package version after upgrade"
I am running NetXMS Server 3.9.298, and am trying to install the agent 3.9.334 and will upgrade the server soon afterwards.
I have never tried this before.Looking at the agent logs, it seems to be receiving the file in chunks, which are then merged back into the original .exe.
I see this in the log also:2021.10.29 11:33:38.769 *D* [procexec ] ProcessExecutor::execute(): process "CMD.EXE /C "C:\NetXMS\var\nxagent-3.9.334-x64.exe" /VERYSILENT /SUPPRESSMSGBOXES /LOG /FORCECLOSEAPPLICATIONS /NORESTART" startedwhich I guess is good news, but I can't see anything obvious after this.
All agents I am trying to upgrade are on the same LAN, so I doubt it's a network problem.
I ran the above command manually on one of the failing servers, and it worked. -
Network monitoring- YouTube
YouTubessa voit nauttia parhaista videoista ja musiikista, ladata alkuperäistä sisältöä ja jakaa kaiken ystäviesi, perheesi ja koko maailman kanssa.

(www.youtube.com)
-
Grafana Datasource connecting, but cannot graph any DCIs or show alarmsNever heard of wildfly, I will check it out.
We are currently using tomcat 9.0.31 and openjdk 11.0.11. -
Notification channel driver for Microsoft TeamsHi Filipp,
Thanks for the reply.
Yes, the first command didn't work as it says "GET not supported".
The second command worked, although you need to enclose the "-d" option with single quotes instead of double as double quotes are used in the data.
It looked like it worked:Node up 28.Sep.2021 14:56:12\n\nNormal] xxxxxx: Node up" }' * Trying 52.97.146.162:443... * TCP_NODELAY set * Connected to xxxxxxxx.webhook.office.com (52.97.146.162) port 443 (#0) * ALPN, offering h2 * ALPN, offering http/1.1 * successfully set certificate verify locations: * CAfile: /etc/ssl/certs/ca-certificates.crt CApath: /etc/ssl/certs * TLSv1.3 (OUT), TLS handshake, Client hello (1): * TLSv1.3 (IN), TLS handshake, Server hello (2): * TLSv1.2 (IN), TLS handshake, Certificate (11): * TLSv1.2 (IN), TLS handshake, Server key exchange (12): * TLSv1.2 (IN), TLS handshake, Server finished (14): * TLSv1.2 (OUT), TLS handshake, Client key exchange (16): * TLSv1.2 (OUT), TLS change cipher, Change cipher spec (1): * TLSv1.2 (OUT), TLS handshake, Finished (20): * TLSv1.2 (IN), TLS handshake, Finished (20): * SSL connection using TLSv1.2 / ECDHE-RSA-AES256-GCM-SHA384 * ALPN, server accepted to use h2 * Server certificate: * subject: C=US; ST=Washington; L=Redmond; O=Microsoft Corporation; CN=*.webhook.office.com * start date: May 12 00:00:00 2020 GMT * expire date: May 12 12:00:00 2022 GMT * subjectAltName: host "xxxxxx.webhook.office.com" matched cert's "*.webhook.office.com" * issuer: C=US; O=DigiCert Inc; CN=DigiCert Cloud Services CA-1 * SSL certificate verify ok. * Using HTTP2, server supports multi-use * Connection state changed (HTTP/2 confirmed) * Copying HTTP/2 data in stream buffer to connection buffer after upgrade: len=0 * Using Stream ID: 1 (easy handle 0x56077e955e10) > POST /webhookb2/xxxxxxx HTTP/2 > Host: xxxxx.webhook.office.com > user-agent: curl/7.68.0 > accept: */* > content-type: application/json > content-length: 93 > * We are completely uploaded and fine * Connection state changed (MAX_CONCURRENT_STREAMS == 100)! < HTTP/2 200 < cache-control: no-cache < pragma: no-cache < content-length: 1 < content-type: text/plain; charset=utf-8 < expires: -1 < server: Microsoft-IIS/10.0 < request-id: e043cd8f-7a80-4713-4620-fe2db9000165 < strict-transport-security: max-age=31536000; includeSubDomains; preload < x-calculatedfetarget: CWLP265CU017.internal.outlook.com < x-backendhttpstatus: 200 < x-feproxyinfo: CWLP265CA0401.GBRP265.PROD.OUTLOOK.COM < x-calculatedbetarget: CWXP265MB1910.GBRP265.PROD.OUTLOOK.COM < x-backendhttpstatus: 200 < x-aspnet-version: 4.0.30319 < x-cafeserver: CWLP265CA0401.GBRP265.PROD.OUTLOOK.COM < x-beserver: CWXP265MB1910 < x-rum-validated: 1 < x-proxy-routingcorrectness: 1 < x-proxy-backendserverstatus: 200 < ms-cv: j81D4IB6E0dGIP4tuQABZQ.1.1 < x-feserver: CWLP265CA0401 < x-powered-by: ASP.NET < x-feserver: LO2P265CA0472 < date: Sat, 16 Oct 2021 13:18:24 GMT < * Connection #0 to host xxxxx.webhook.office.com left intactwhich I guess looks good. If I change the GUID-type part of the URL it fails, so the URL is correct. I can't check if anything arrived in the Teams channel until I go back to the office on Monday
-
Status Dashboard Like "Port View"?Thanks, I will try that on the next version!
-
Grafana Datasource connecting, but cannot graph any DCIs or show alarmsI am trying to get Grafana to work with NetXMS:
Both are on the same server.
Browsing to the server with /api and /api/info displays version information in JSON format.
I have created the Data Source, and when I click Save & test, it replies with "Data source is working".When I try and select a Target, the drop down box is empty (I assume it should fill with a list of choices)
When I try and add an alarm list, again, I don't get a list of choices in "Source". If i leave it blank, use "*" or "%" (hoping to show all alarms) I get a JSON reply of column names, but no actual data.
As a test, I've added "allowed_origins = *" to the grafana .ini file as I was seeing some warnings, but although the warnings are now gone, it is still not working.
What am I doing wrong?
-
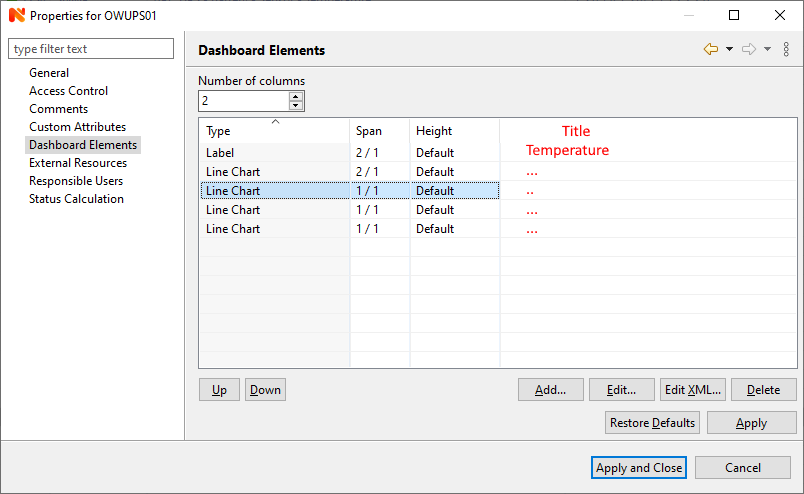
Add titles of Dashboard Elements in Dashboard properties for easier editingWhen Dashboards get complicated, it's not easy to figure out which element is which, when going back in to edit them.
Would it be possible to add something to make it easier to see which is which, without double clicking on each one to check?
For example, (please see screenshot attached) the title of the element could be added as a new column in the list, so it is more obvious.Thanks!
-
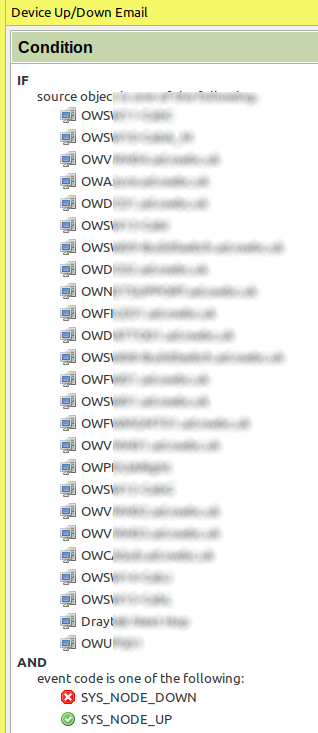
Alphabetize Source Objects in Event Processing PolicyI now have quite a few servers I want to monitor for "Node Down", but don't want to just allow everything or i'd get too many alerts as Network Discovery is enabled.
In the IF Condition, the order of the objects seems to be in an odd order (see picture). It doesn't seem to be the order I added them to NetXMS either.
Would it be possible to allow the list to be in Alphabetical order, so it's easier to see if an object has been missed out?Thanks,
Chris
-
Status Dashboard Like "Port View"?I would like to graphically show the status of DCIs I am mapping as colours depending on their value.
For example, I have a PDU that reports its status of "on" or "off" in a separate SNMP OID for each socket.
I would like to be able to show this as coloured items like the "Port View" or "Status Indicator" Dashboard Elements (eg. Red for "off" and Green for "on"). Is this possible? -
Table / List of Software updatesThanks.
The reporting server might do what I want, but in the docs it says "...Unpack netxms-reporting-server-2.0-M2.zip into some folder...." but I can't see anything named similarly, and the download page doesn't mention it at all
Has anyone set this up? -
Table / List of Software updates -
"Invalid network mask /3" being reported incorrectly for VMWare vCenterI've logged a support request with VMware, so I'll see what they say from their side
-
Documentation Changeshttps://www.netxms.org/documentation/adminguide/service-monitoring.html - It mentions a menu item called "Create Network Service…", but I can't find this on any menus on Version 3.9.280.
In both
https://wiki.netxms.org/index.php?title=Agent_Configuration_File&mobileaction=toggle_view_mobile
and
https://www.netxms.org/documentation/adminguide/appendix.html?highlight=enablearbitrarycommandexecution
it would be good for some examples to be included for Action and ActionShellExec.
It says "See the Agent Configuration section for detailed description of this parameter.", but there's no link, and I can't find what the syntax should be, and how to escape quotes etc.
Also, on the same page, are parameters DisabeIPv4 and DisabeIPv6 typos?Thanks!
Chris