
continued:
is there a generic bandwidth monitoring template for the netxms client?
any help appreciated 
continued:
is there a generic bandwidth monitoring template for the netxms client?
any help appreciated
Victor Kirhenshtein thank you for your reply
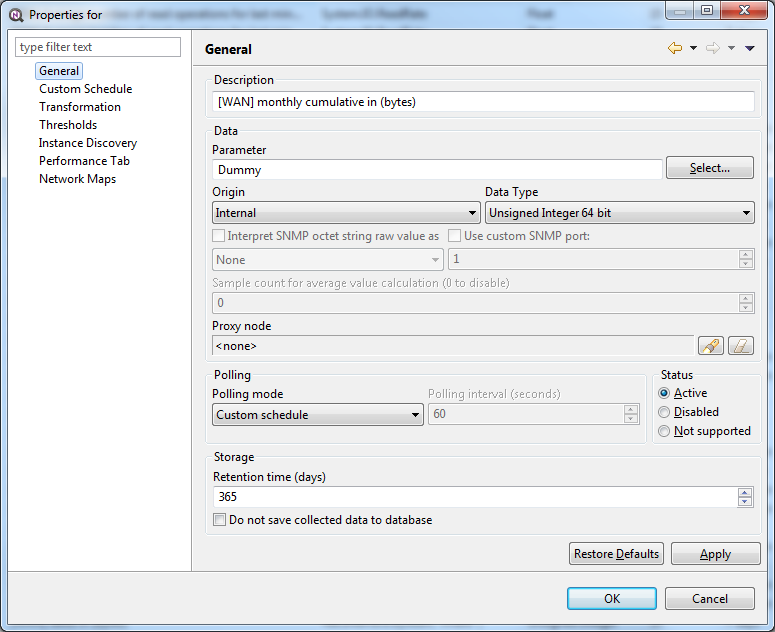
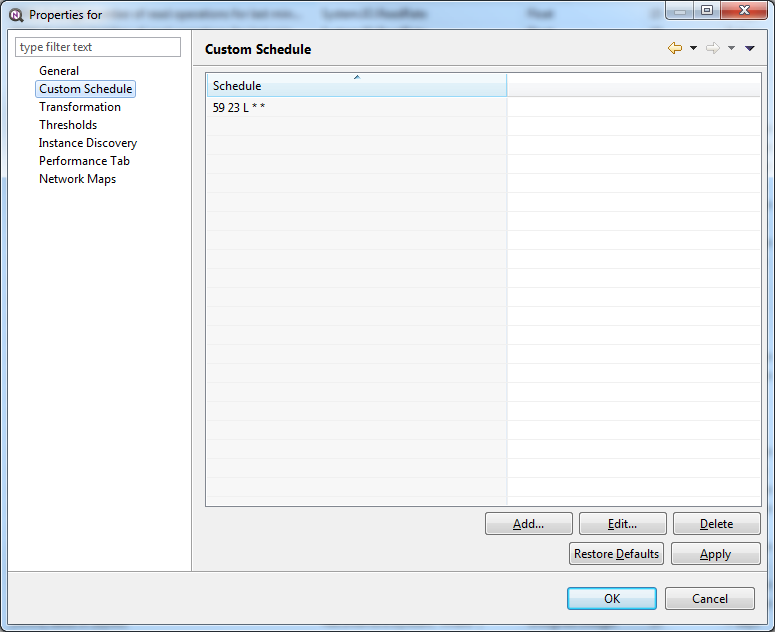
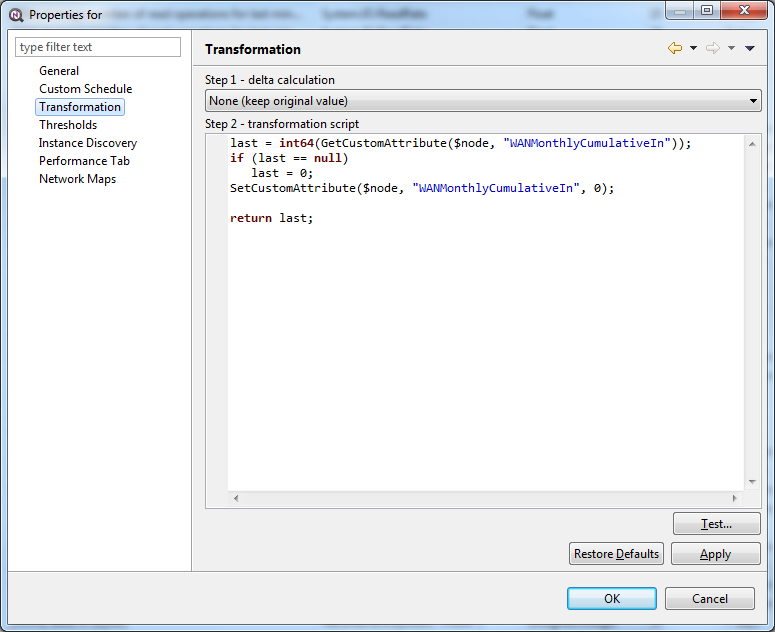
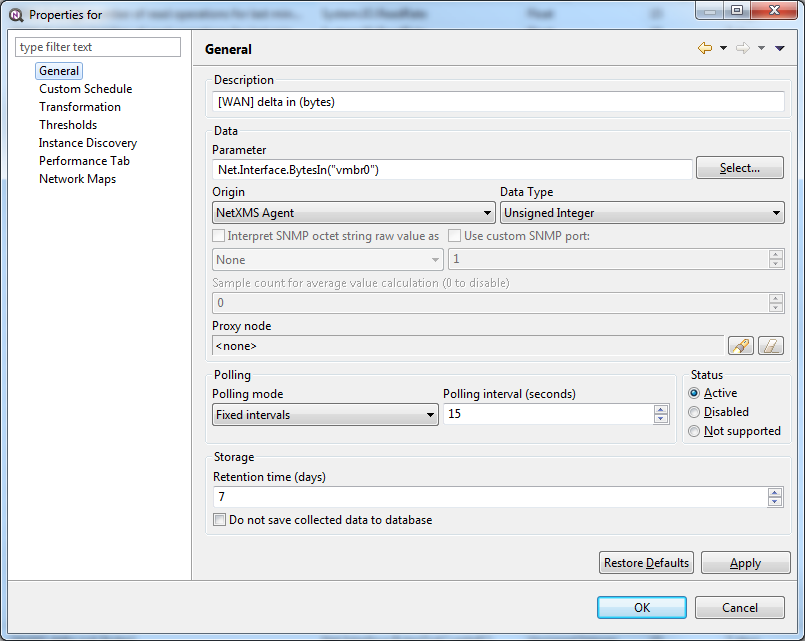
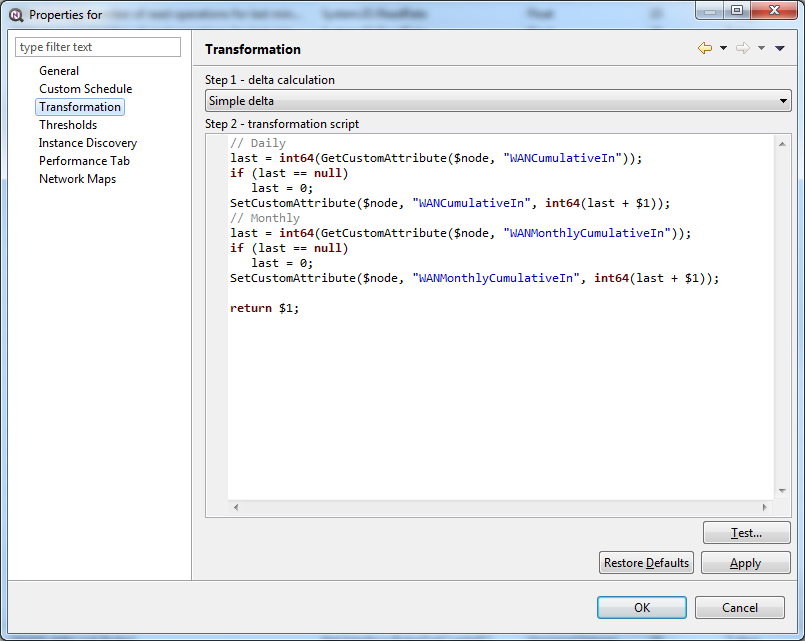
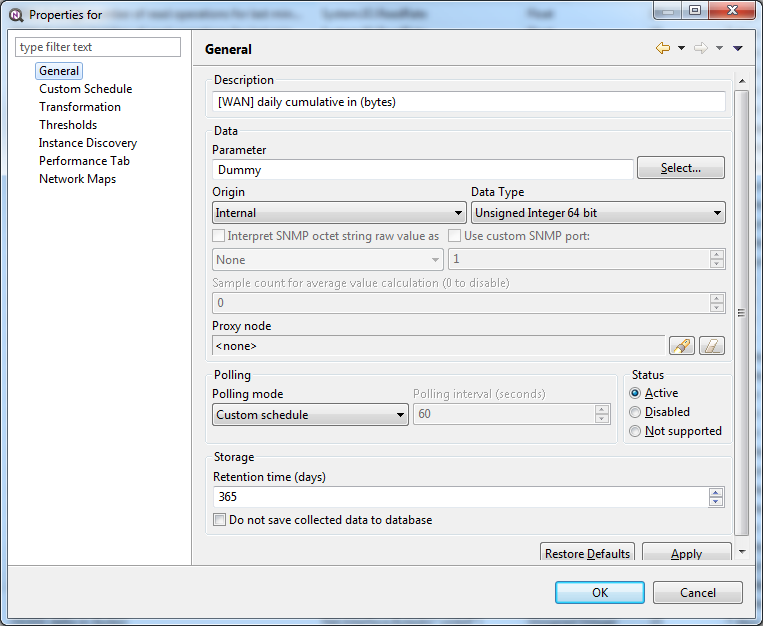
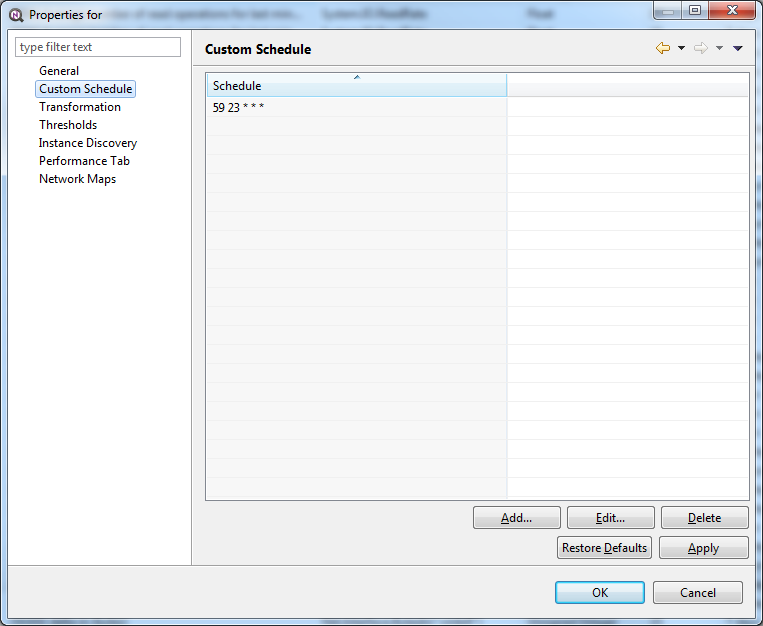
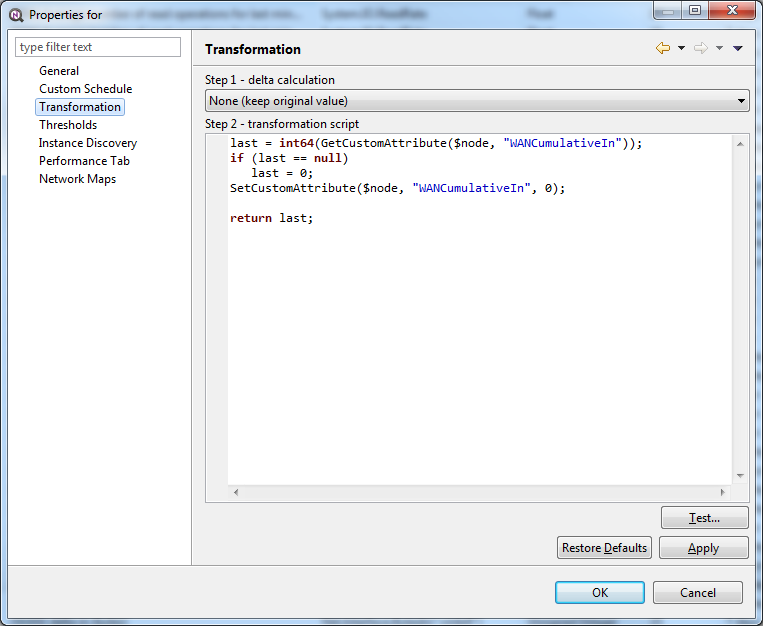
please find the configuration for the DCI Template called " DataUsage "
the daily count the daily or monthly traffic:
Same story for the "out" counter.
Victor Kirhenshtein thank you for your support
i have created a template called " bandwidth "
i used the example as in - https://www.netxms.org/forum/general-support/bandwidth-accounting/
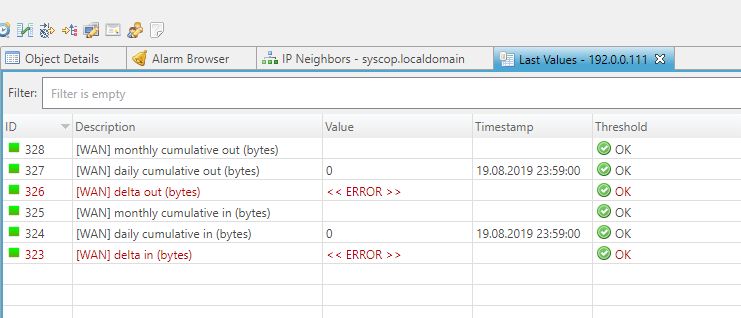
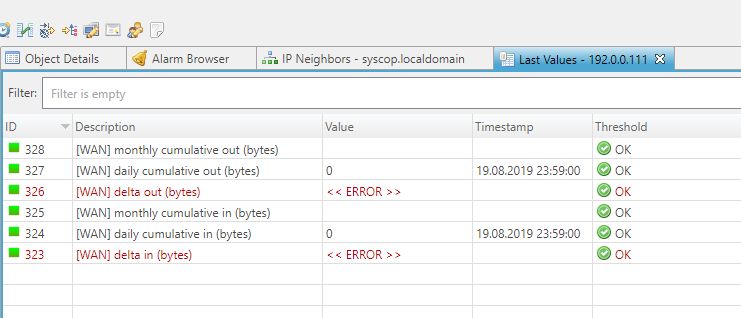
i have applied the template to two systems however i am not getting any readings.
the line / bar / pie / chart shows NO values
See picture attached of the " Last Values "
would you recommend that i enable " SNMP " on all the workstations and monitor the bandwidth via snmp?
any help greatly appreciated
guys please can you help me
how do i do this for each user as i have over 100 computers to monitor bandwidth usage
any help greatly appreciated
Victor thank you for your reply, much appreciated
just to recap
i use a remote windows 10 pro pc.
NETXMS Agent is installed on the remote Windows 10 Pro PC
The NETXMS Agent Config file on the Remote Windows 10 Pro PC includes
EnableProxy = yes
EnableSNMPProxy = yes
snmp enabled on the Remote Windows 10 Pro PC as a Service
snmp community = public ( as an example, On the Remote Windows 10 Pro PC )
snmp security = Accept SNMP Packets from any host ( On the Remote Windows 10 Pro PC )
snmp Enabled on All Devices of LAN eg: Printers and Switches with Community = public
Created a New Zone in NETXMS Server (under Entire Network) eg: SITE1
Questions:
any help greatly appreciated
guys please can you help the noob
I have the latest NETXMS Server installed and have a remote site with a Windows 10 Pro Desktop.
I have installed the Netxms Agent on the Windows 10 Desktop
I have enabled Zoning
EnableProxy = yes
EnableSNMPProxy = yes
I have enabled " Agent to Server Connection ( Tunnel ) for Remote Agents
The Netxms Server IS monitoring the Remote Windows 10 Pro Desktop and is Working perfectly
My Question is the Following
On the Remote Network from where i am Monitoring the Windows 10 Pro Desktop i have 3 x Printers and ADSL Router of which i have Enabled SNMP on ALL the Devices
I need to Monitor the Remote Printers and the ADSL Router
How do i do this with the Remote Windows 10 Pro Netxms Agent using the Windows 10 Pro Netxms Agent as a Proxy for SNMP?
Or must i also " ENABLE " SNMP Trap " on the Remote Windows 10 Pro Desktop and then " Forward the SNMP Logs from the Remote 3 x Printers and ADSL RTouter to the Remote Windows 10 Pro Desktop PC?
Sorry for the noob question, i am trying to establish how Remote SNMP Traps work including monitoring Multiple Remote SNMP Devices that are on Multiple Remote Networks
Any help greatly appreciated
Victor Kirhenshtein thank you for your reply
" Do you see incoming client connection in server log when attempt to save Grafana data source? Can you login with same user from web UI? "
will that be the login user for Grafana Web UI or the NetXMS Web UI or the WEBAPI ?
http://localhost:8181 ( Grafana Web UI )
http://localhost:8080 ( NetXMS Web UI )
http://localhost:8080/webapi ( NetXMS Web API - {"description":"Internal error","error":46} )
sorry just need to confirm
Victor Kirhenshtein thank you for your help, much appreciated
i have changed the grafana http port to 8181
started the grafana engine and success!
grafana is working
now for the data-source creation
There is an exclamation mark error!
It does save the settings
Restarted both NetXMS Server and Grafana Server
I do not think that Grafana is working correctly
Any ideas?
guys please can you help me,
I need your help with my Grafan installation on a Windows 10 System
I have the latest NetXMS System installed with a MySQL Database on Windows 10 and it is working perfectly however i am having a problem getting Grafana to work on the same system
I am using NetXMS " Jetty " for http
I deployed the NetXMS WebAPI using the same guide https://wiki.netxms.org/wiki/Deploy_NetXMS_WebAPI_using_the_WebUI_Windows_installer_(Windows_only!).
When i use the URL : http://mynetxms.ip:8080/webapi/ all i get is " {"description":"Internal error","error":46} "
I have unziped the Grafana Files in C:\grafana
I have edited the " c:\grafana\conf\custom.ini " file
protocoal = http
http_port = 8080
domain = localhost
What else do i need to do to get Grafana to function on the Windows 10 System ?
i am new to netxms and am using windows 10. i need to know the installation requirements for the database and web server services
Do i need to Install the following on my windows 10 ?
any help greatly appreciated