
Hello,
Is there an external SOAP or REST api for NetXMS?
Hello,
Is there an external SOAP or REST api for NetXMS?
Yes, this appears to be an issue with such screens (both a 2k display on a Lenovo x1 carbon and a Surface Book which is 3000x2000).
Hello all,
When I have NetXMS installed on a windows 10 machine that has display scaling (surface book in this example, but also occurring with a Lenovo X1 carbon), there are issues with how network maps display. I've attached two files, one is the desktop client, the other is the web client. As you can see, in the web client, things display correctly. The desktop client is another story entirely.
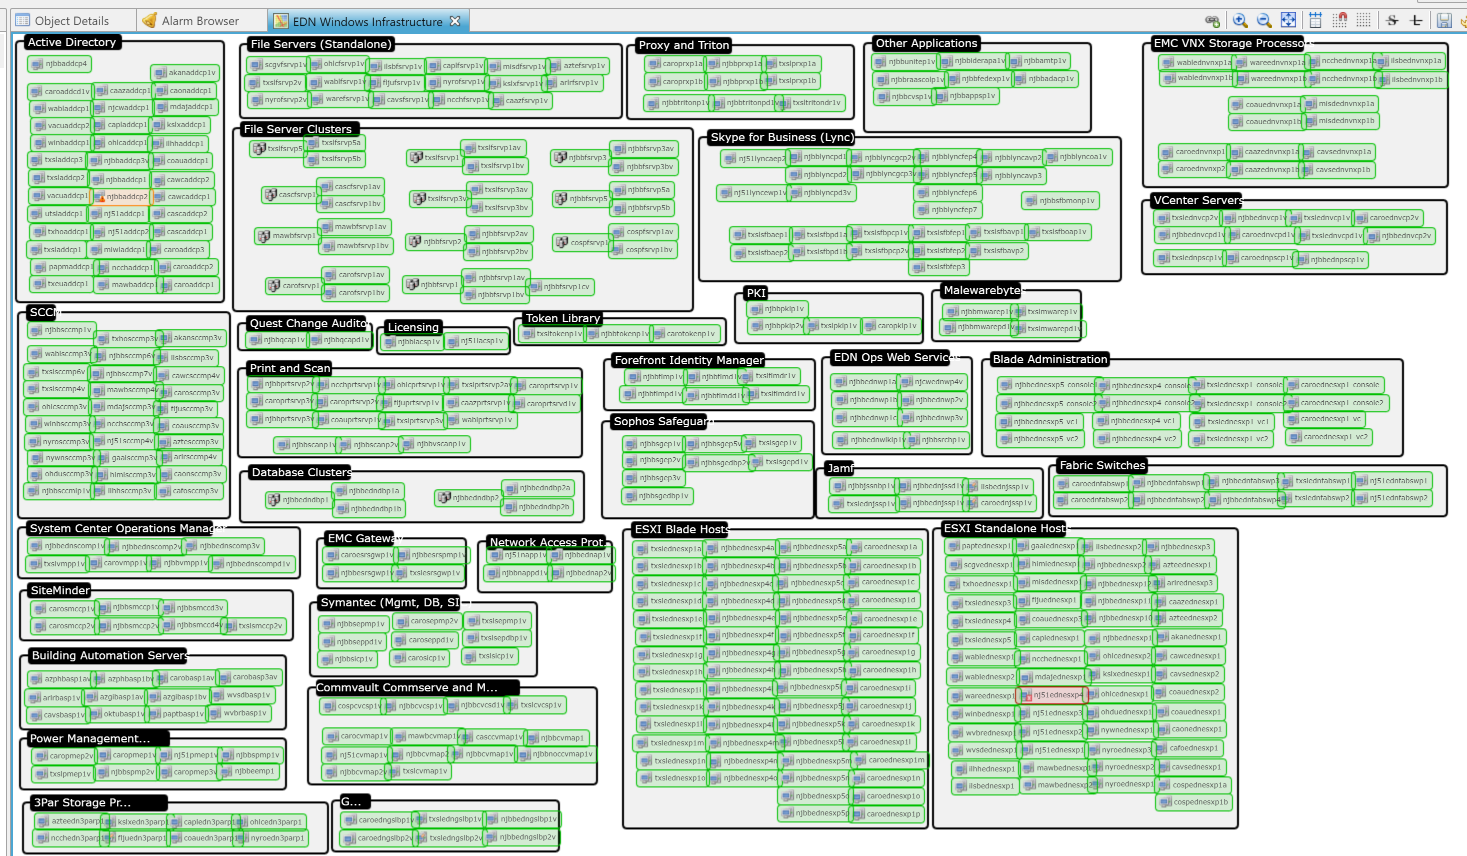
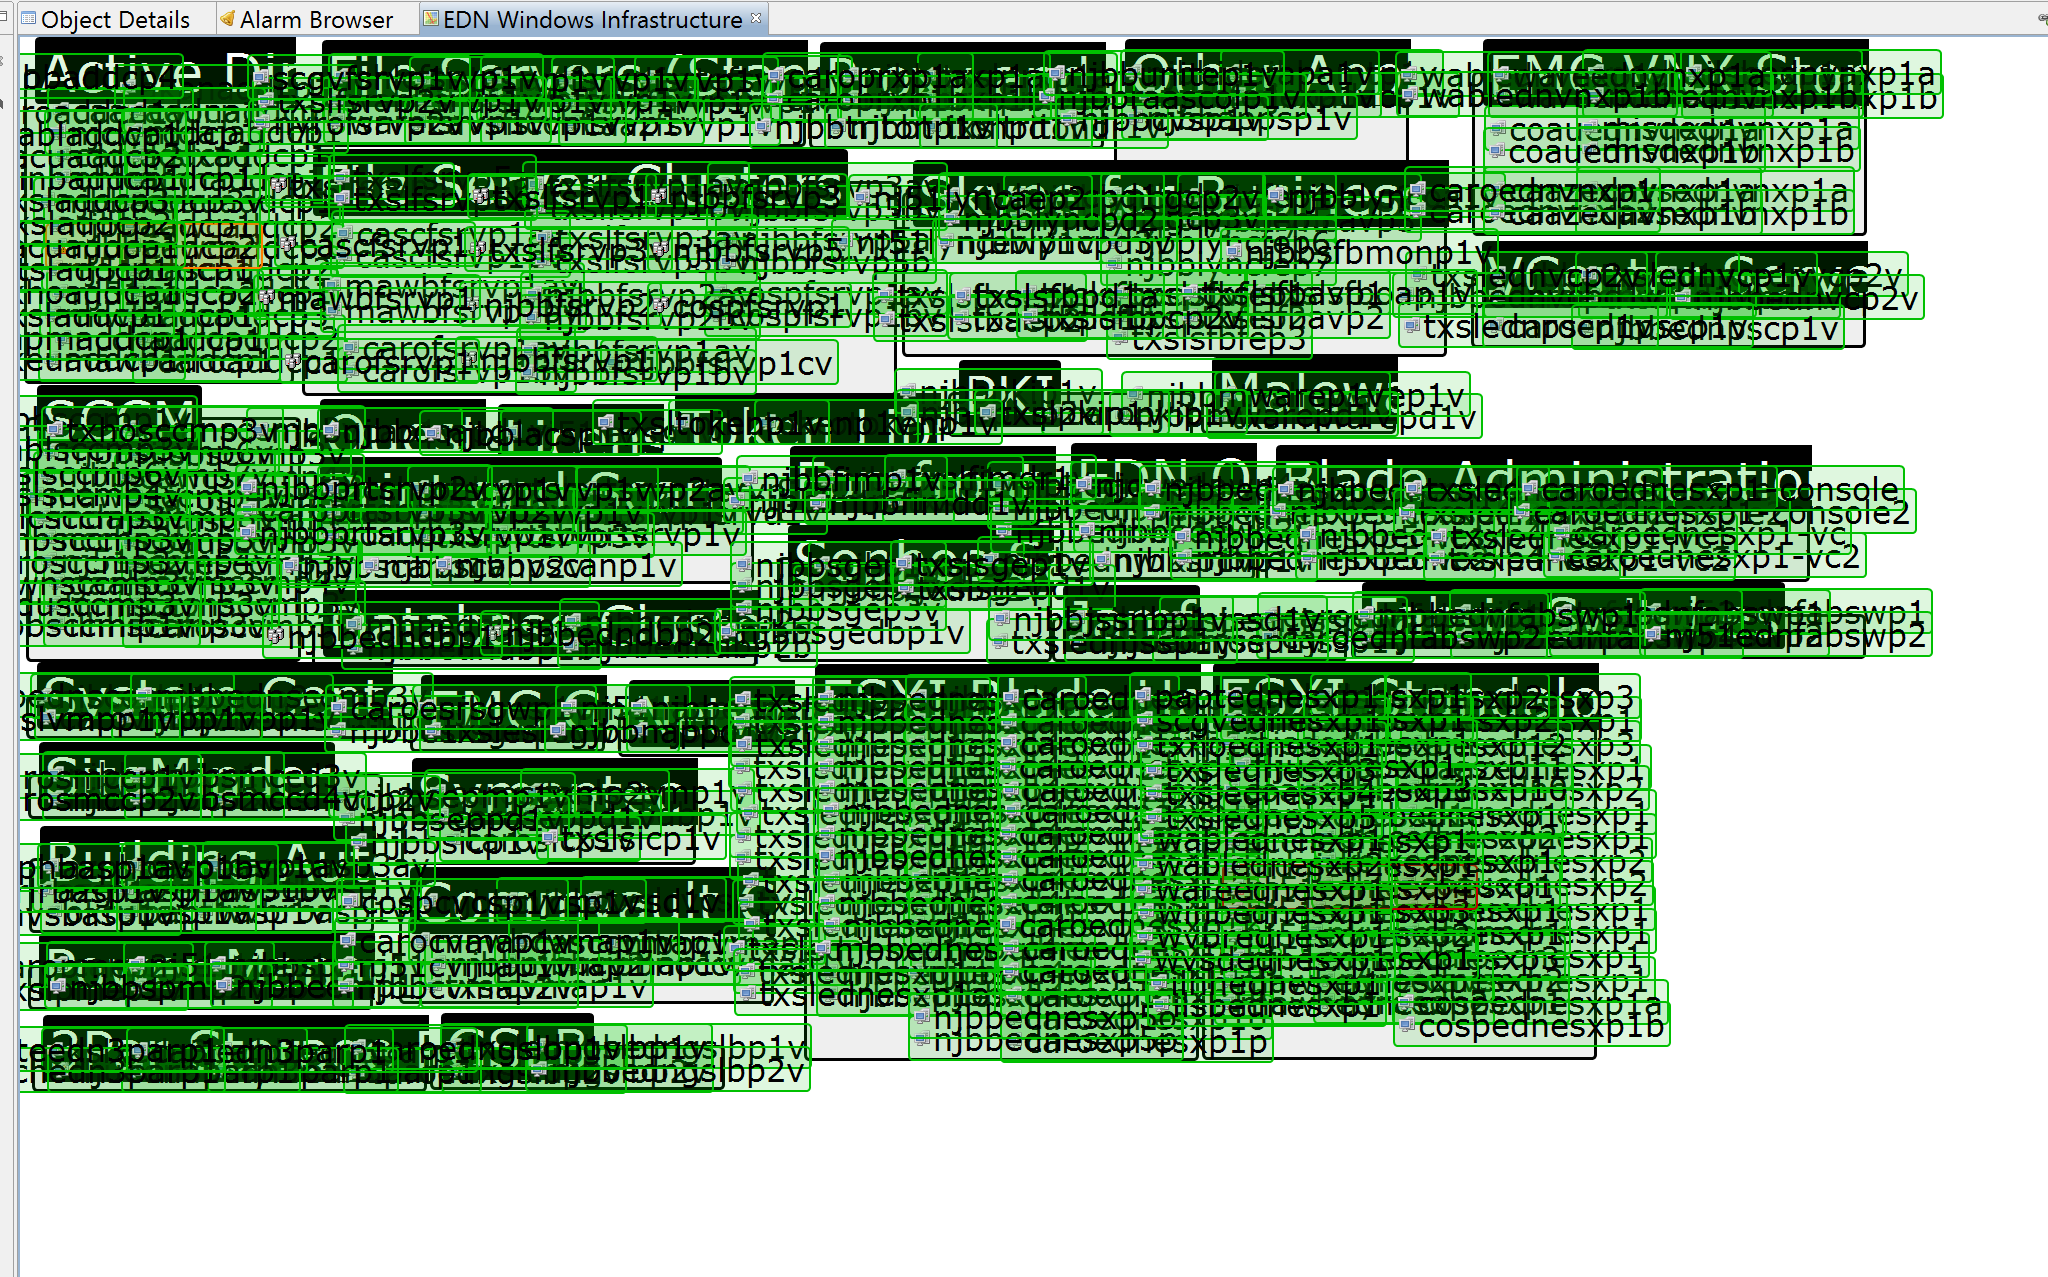
Was there some other info you needed me to get?
Maybe this could be added then? And thanks for the info on the node status. I would just put that as an auto apply rule to the container, right?
Also, just to make sure, nodes can be in multiple folders at once, right?
This is on a windows client running windows 10. Server is on a server 2012 r2 server. This is the desktop client, not web.
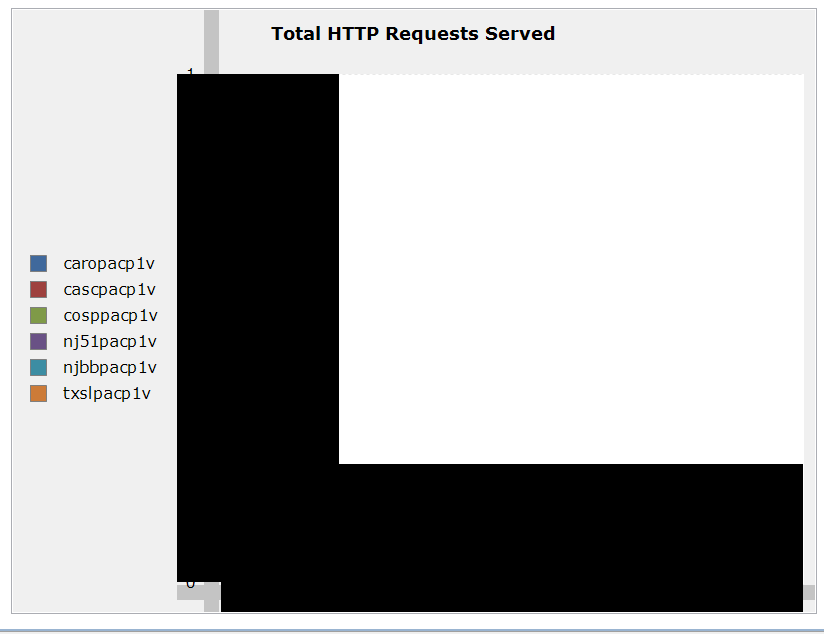
I attached a screenshot. I had this issue both with 2.04 and 2.06 server and client.
Hello all,
I'm getting the following graphical bug when making a bar graph. This actually expands until it covers the entire screen. thoughts?
Any ideas how I would do that for servers in maintenance mode, and servers with a "problem" of some sort?
yeah, I saw that post. Tried that, but still not getting any info
Hello,
How would I automatically create groups/views of servers/nodes? For example: a view where I can see all the servers that are in maintenance mode.
I'm guessing it may have something to do with the auto apply rules, but I'm not 100% sure.
Thank you.
Hello,
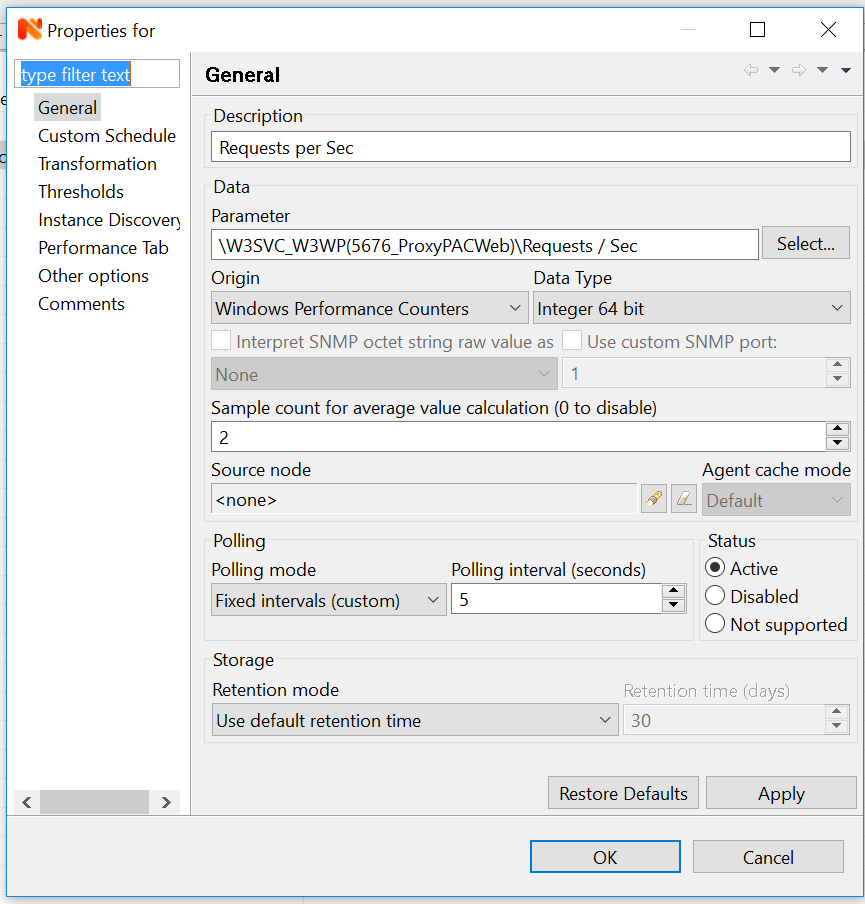
Had this working at one point, then it seemed to stop working. I'm pulling the windows performance counters for requests per second from w3svc. right now, the counters appear green, but all show 0. Windows itself shows this to be incorrect. Currently running version 2.06 server and a mix of 2.04 and 2.06 agents.
Would there be a way to make this into a dashboard of sorts, with multiple graphs and the like?
Perhaps I'm looking at something wrong. I'm unable to right-click on a performance graph. Is there another way to view the graphs that I'm missing?
Hello,
Is it possible to have a performance graphs with multiple nodes on it? for example, windows perf counter of w3svc requests/second where I see 3 servers at the same time?
Thank you.
Hello,
I have a server cluster serving files over port 445. I have a custom service check for that port that is working fine for other server, but not for this cluster. I've checked all nodes of the cluster, they have active listeners on port 445. Thoughts?
Perfect, thank you.
Any place where the event parameters %1-%99 are spelled out?
Exactly what I was looking for. Thank you.
would be tough to grep on a windows server...
More than likely it's the HP C7000 mibs that I'm trying to import that are being problematic. I'll have to play around with them some more, see if I can't find some better mibs out there.