
this is still an issue.
what are my options to get this resolved?
this is still an issue.
what are my options to get this resolved?
attached.

Hi all!
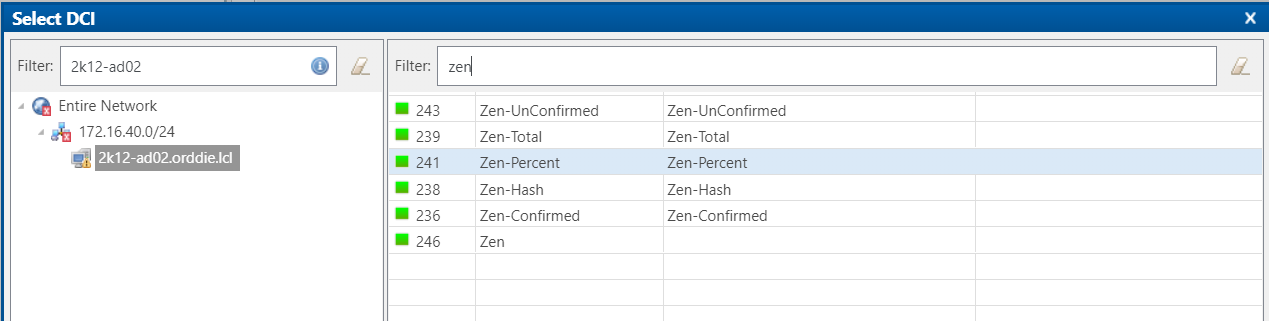
have a DCI which is pulled from an agent installed on a windows computer. I'm able to view the collected history of that DCI when i right click and select show data.
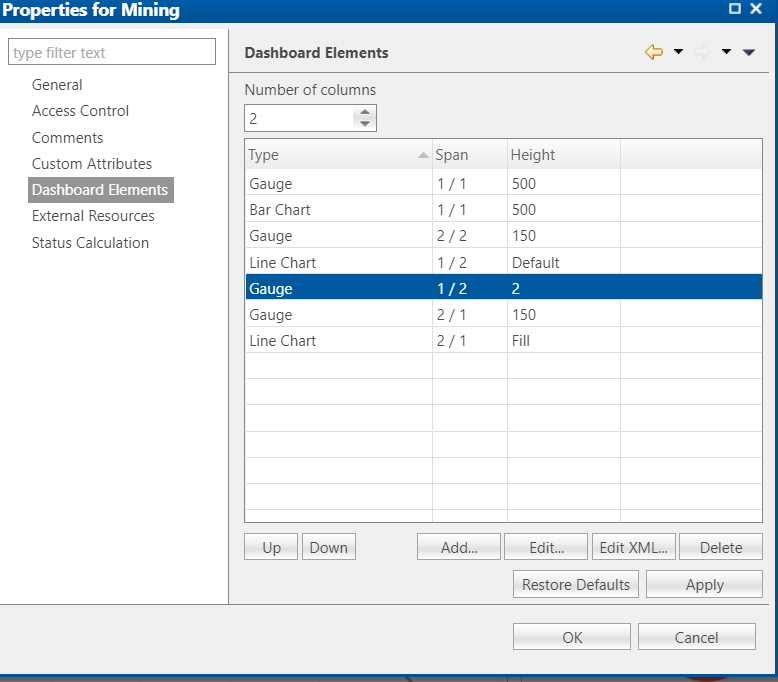
I'm trying to reference that DCI within a dashboard but its not available for selection.
any suggestions?
I have no idea what the difference is today verse two days ago but I found the agent is now working.
Thanks!
host is ubuntu and below is the following output while checking the firewall status
sudo ufw status
[sudo] password for user:
Status: inactive
Hi All!
having issues with Linux Agent sadly. below is my config file and im not able to telnet to port 4700 either from the local box or from the management server 
I started the agent via
nxagentd -D 9
and when I telnet I do not get any type of response from the system.
config file
EnableWatchdog = no
MasterServers = 172.16.40.254
LogFile=/var/log/nxagentd
Debug_Level = 9

SubAgent = lmsensors.nsm
#SubAgent = linux.nsm
SubAgent = ping.nsm
SubAgent = logwatch.nsm

*LMSENSORS
UseFahrenheit = no
hi!
using version 1.2.11 of the web interface (yes the backed is the same version). When i double click the dashboard that works in the client, nothing happens. When i right click a node, i do not have the option of object view.
Please help!
changing data type to floating point number looks like it fixed this. 
Hey all,
Im looking to collect a DCI such as 0.32842957
Currently it's being stored as zero. However, the last value does show 0.32842957.. but when you right click that value and say show history.. its only displaying 0
spot on. thanks much!
Hi All,
Looking in my windows 7 event log today under system, i saw a ton of these messages. A few every second.
SQL query failed (Query = "INSERT INTO idata_360 (item_id,idata_timestamp,idata_value) VALUES (?,?,?)"): Table 'netxms.idata_360' doesn't exist
Any idea how to resolve?
Hi!
Yes everything matches. Im asking the router for data every 60 seconds. I have the graph refreshing data every 60 seconds as well with a 60 second interval.
looking at the data collected from the router, it's happening every minute.
when i did a object view --> perforumance view... i notice the graph there was every 10 minutes. changing the dashboard to view every 10 is now showing data. this work i guess... but if im collecting every minute... why can I not get up to the minute data?
thanks for the resoonse!
i do have data for both
Hey All,
Im having an issue with a bandwidth dashboard graph. It's blank! can you help me out? When i look at the perforumance tab for the node, i do see a separate graph. Looks like I am having an issue when I combine the two together.


well while driving home.. the GPU temp alerts triggered as they should. I changed nothing... only it happened naturally.
I thank you for your help here... wish i could explain the root cause though.
i tried that. it triggered the to low, but when i removed the return 60; and allowed it too pool again.. It did not trigger the all clear.
Hey All,
Im trying to monitor the GPU temps on a system. I have two thresholds configured for the system.
the first being if the value is less then or equal to 65, send an alert.
the second being if the value is greater then or equal to 75, send an alert.
I have tested both threshold's manually by moving both 65 and 75 numbers around and asking the system to re-pull the current values. Each time the testing triggers the alert as expected, but does not resolve the alarm.
examples..
Current temp is 74, i set the too low value to 76 and too high value to 78. I got the too low alert. When i changed the two low number to 65 and left the too high to 78, the alarm did not resolve itself.
Current temp is 74, i set the too low value to 65 and too high value to 74. I got the too high alert. When i changed the two low number to 65 and to high number to 75, the alarm did not resolve itself.
the return to normal value is event 100002. I have created an event processing policy to send the all clear email and resolve the alarm. According to the Event monitor tab, the all clear is never getting hit.
If i manually resolve the alarm.. it does not trigger again until the temps are outside of 65 or 75
right on. That solved it!
Thanks!
Im trying to convert a DCI that's in tenths of C under the transformation section.
Its not converting the value when i view object details --> Last Values section. thus far i have tried...
return (($1 * .1) * 1.8 ) + 32;
((int($1) * .1) * 1.8 ) + 32
return $1 * .1 * 1.8 + 32
$1 * .1 * 1. 8 + 32
Can anyone help? the $1 is pulled from SNMP INT value.
Hi All,
I have downloaded several MIBS which should take care of unmatched SNMP traps being sent. Infact, when i copy and past the SNMP trap that's being sent, and try and create a SNMP Trap Configuration... It finds a match.
Any idea what is going on here? Why is the system not searching the SNMP mibs for a match when a trap is received?