
Hi Victor. Thanks, I'll try doing that. I've turned on deadlock logging also, so hopefully I can capture something.
Regards,
Richard
Hi Victor. Thanks, I'll try doing that. I've turned on deadlock logging also, so hopefully I can capture something.
Regards,
Richard
Upon arriving in the office this morning, I'm getting the following error repeating every ~50 seconds:
2019.10.03 08:54:42.739 *E* [db.driver ] SQL query failed (Query = "INSERT INTO idata_12102 (item_id,idata_timestamp,idata_value,raw_value) VALUES (64537,1570043031,'0','0')"): Lock wait timeout exceeded; try restarting transaction
Different values, but always table idata_12102. I'm using MariaDB (latest 10.1.41 on Windows) and I've run "SHOW OPEN TABLES WHERE in_use>0" which always shows the following:
Database      Table            In_use        Name_locked
--------------------------------------------------------
netxms_db     idata_12102           2                  0
The server (build 2305) has been up around 18 hours or so. I attempted to shut down the server - it started to shut down but seemed to hang (and the lock message again continues to repeat every 50 seconds). After waiting around 5 minutes I decided to kill the server.
After the server was terminated, the in_use still remained at 2, then after a minute or so it reduced to 1. I waited around 5 minutes but the in_use count never reached 0.
I then shutdown the MariaDB server, which took around 8 minutes, during which the mysql process had high CPU and high disk IO, so I assume there was considerable uncommitted data that is either committing or rolling back. After restarting MariaDB, the in_use query returned no results. Admittedly I didn't check MySQL activity whilst I was waiting for NetXMSd to terminate, so possibly it was attempting to commit these transactions which I inadvertently interrupted.
I then restarted netxmsd and the in_use query returns no results (no active locks). From my graphs via the GUI console I can see that the past 2.5 hours of DCI values are missing, so I assume all those transactions were waiting on the lock to clear which never did and were rolled back. New DCI values are populating as normal.
After doing some investigation, I see from the windows event logs that this error relating to lock on idata_12102 started around the time where my data loss begins (8:08am). However, prior to that I see lock errors relating to different tables dating back to around 2am. I assume these lock issues eventually cleared.
Worth a mention is that since upgrading to v3 I had some errors about the DB connection pool being full so I increased DBConnectionPoolBaseSize to 30 and DBConnectionPoolMaxSize to 100. Although these errors still seem to persist looking at the logs.
Attached is an export of the windows event log for NetXMScore relating to the ~18 hours of runtime during which this lock event occurred.
Regards,
Richard
Hi Victor,
Attached is the log.
I also removed some of the DCI's from the template assigned to this node, which resulted in ~200 fewer DCI's for this node, and the problem seems to have resolved itself. After doing this I was able to confirm that the node has around 4200 DCI's configured.
Regards,
Richard
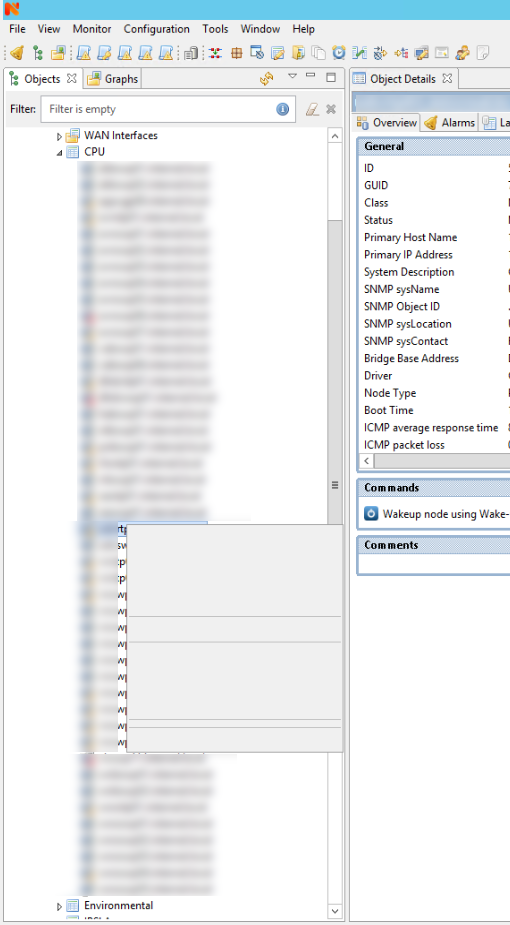
Another showing the "small" right click corrupted menu.
Just to add, this setup has been working well for a few years (since version 1). Did an upgrade a week or so back from 2.2.something to 3.
When I open a dashboard in Edit Mode, make some changes, but decide not to save, the changes remain persistent until I close and reopen the console again.
Console build 2284.
Some screenshots
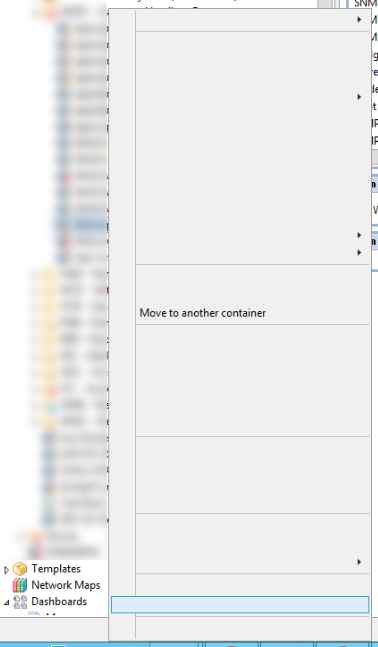
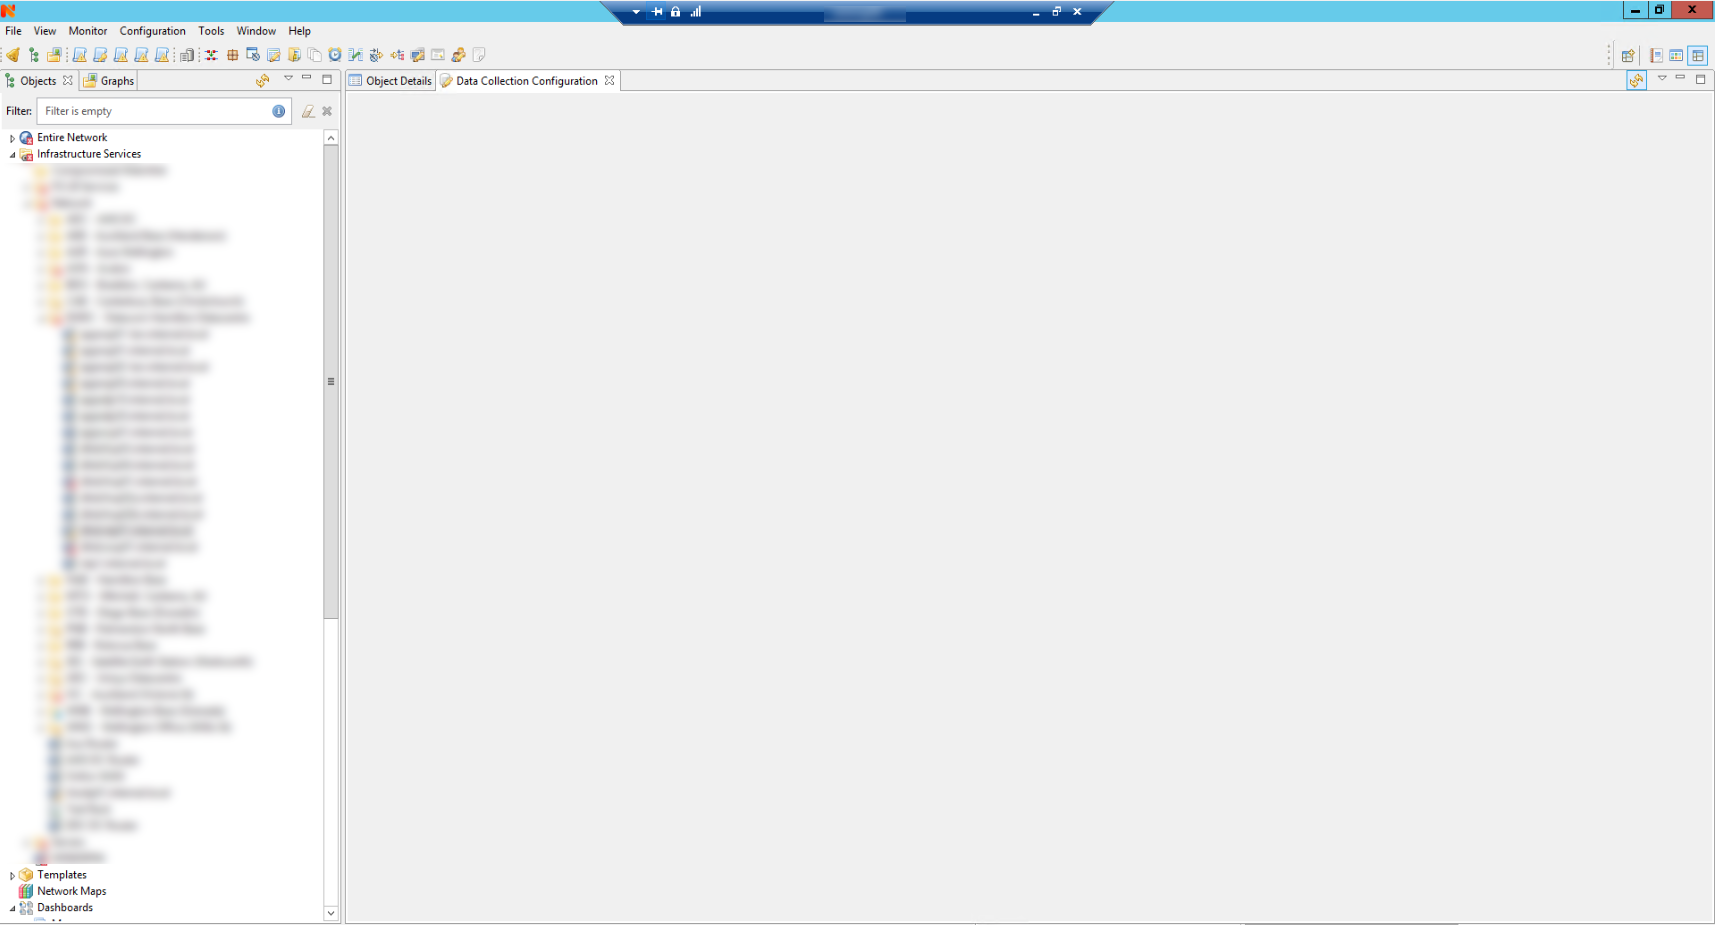
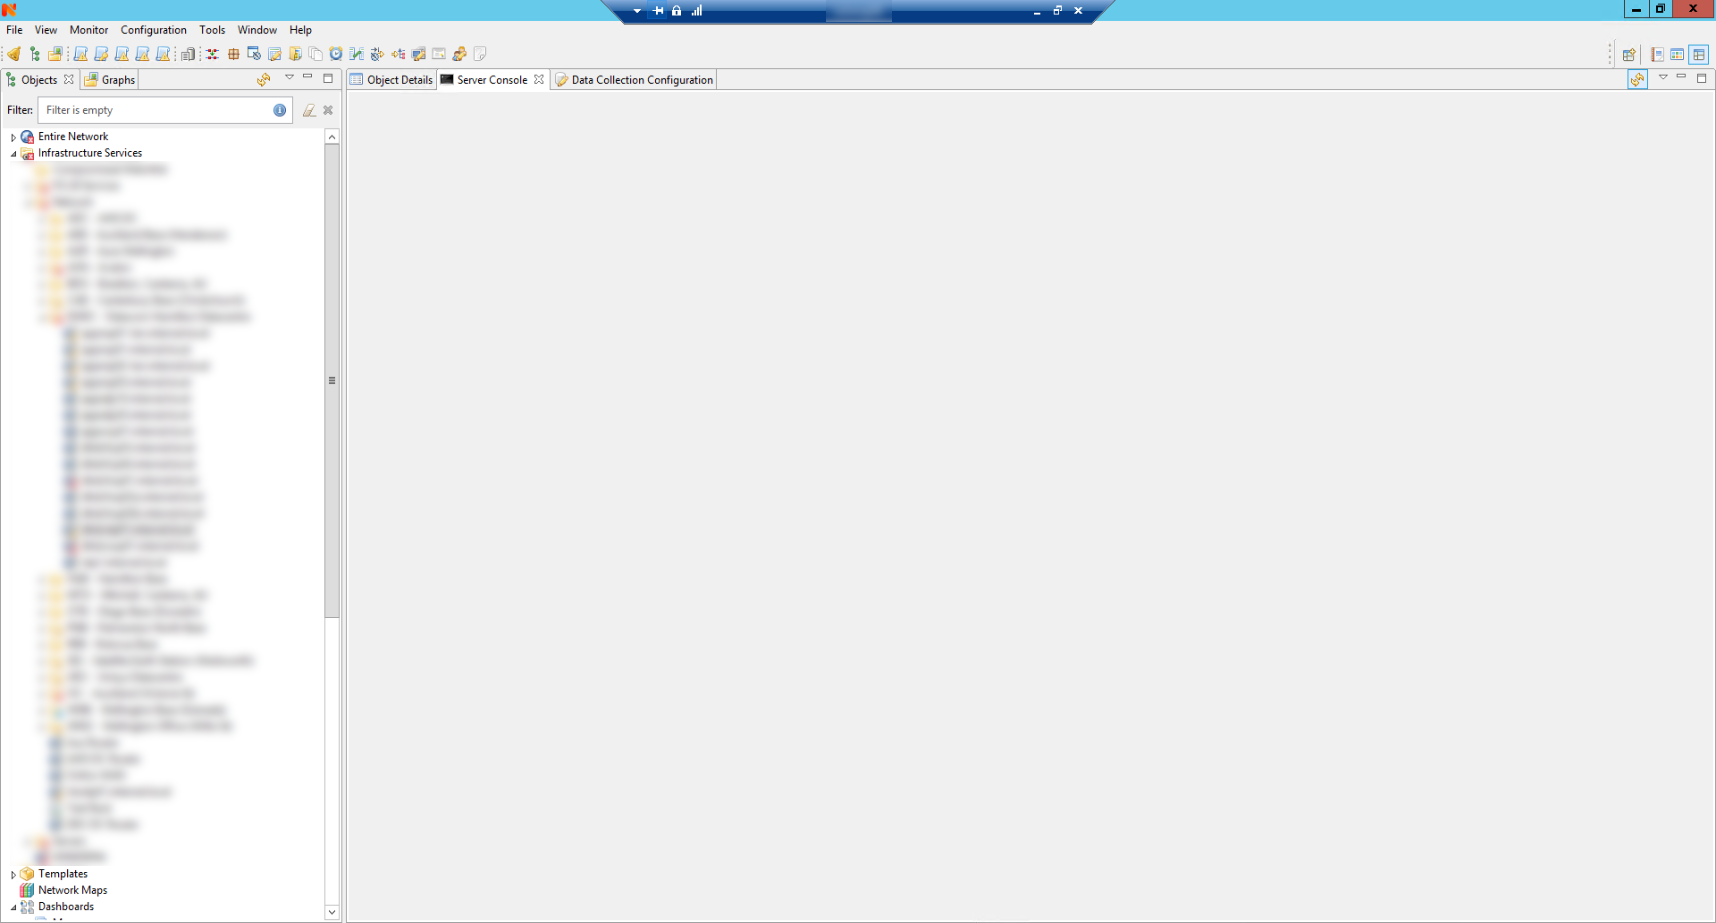
Hi.
I've just upgraded to v3 (2305). I'm having a problem accessing some devices in the console, and it appears to be the ones with large numbers of interfaces or DCI's.
I don't recall the issue with v2, although I did add a few more DCI's since upgrading to v3 which could have tipped it over some limit.
Symptoms:
When I right click on a node, sometimes get the hourglass for ~30s and then nothing happens. Right click again and get a somewhat blank / corrupted popup menu about 1/3rd the size of normal, mostly blank, a few populated items. If I click on another (smaller) device it seems to clear the problem and I can then right click successfully on the bigger device. However, attempting to access the DCI configuration, I get the DCI tab pop up but the panel is completely blank. Not even a blank table, just a grey window with no widgets.
The device in question has 350 interfaces, and I would estimate (can't find out exactly) around 4,000 DCI's
Sometimes when this condition occurs, the console starts acting oddly, and I can't access other things like server console, or edit a dashboard (get blank grey tab).
This is running locally on the server (Windows). 6 CPU, 8GB RAM (mostly dedicated to MariaDB cache). Also tried console from a remote PC and same issue. Console is 2284.
Rich
Thanks Tatjana.
Actually, since I ran netxmsd direct from the shell (without the -d flag) rather that from it's init script, it hasn't crashed since.
I'll implement what you suggest and try again using service.
Rich
Ok, I've installed the 'netxms-server-dbg' package with apt. Can you give me some instructions around the ulimit and where it will store the core files please?
From the shell (as root), I issued 'ulimit unlimited' and then restarted netxms 'service netxmsd start' after installing the above package. Is this sufficient?
For info, two further crashes at seemingly random intervals:
Sep 17 00:02:39 netxms1 kernel: [28869.032511] $POLLERS/WRK[1240]: segfault at 0 ip 000055e1da5d8db2 sp 00007f112f3b2ef0 error 4 in netxmsd[55e1da588000+93000]
Sep 17 16:23:09 netxms1 kernel: [87698.483988] $DATACOLL/WRK[7189]: segfault at 0 ip 0000555c79c3f2b9 sp 00007f3bde1502b0 error 4 in netxmsd[555c79bf5000+93000]
Thanks Victor. Yes, that may be a good idea if it's not too difficult.
Perhaps a suggestion for a new feature would be to add a "filter" script that sits between the DCI and, say, a graph. Or perhaps have the ability to select a script as the input to a graph instead of (as well as) a DCI.
Rich
Fairly new install, 2.2.8 on Debian 9.3.
Recently enabled the ping subagent, and configured a few Average Ping and Packet Loss monitors based on a template to around 8 nodes.
Sep 14 19:49:38 netxms1 kernel: [337446.741930] ItemPoller[1969]: segfault at 52e ip 000000000000052e sp 00007f74c70ca3e8 error 14 in netxmsd[564b357d2000+93000]
Anything else I can provide?
Hi,
I have a few years' history in my NetXMS and I now want to apply some different calculations on my past data before it gets graphed. For example, I'm taking Input/Output readings every 60 seconds on a particular interface and I have around 2 years' worth of data. I now want to average over 15 and 60 minutes (so loading of the graph doesn't timeout) and also calculate 95th percentile.
I can create scripts to perform the transform/calculation, and I'm thinking I need to write my recalculated data to a separate DCI but I'm unsure how to do this. I see the PushDCIData function which seems to almost achieve what I want, but I would also need to push a timestamp with the data.
Or am I looking at this the wrong way?
Thanks,
Richard
Ok.
So I have a script in my library derived from the 95th percentile example on the wiki. It runs once per day and works by finding a DCI from the current node based on the DCI's name, pulling the past 24 hours of values, then calculates the 95th percentile and populates the result in the DCI that called the script (i.e. the script "returns" the calculated 95th percentile). This script gets called across multiple devices, and sometimes there are multiple instances per device if I need 95th values for more than 1 interface. This latter use case means I need a way to dynamically work out which DCI to pull the values from.
I therefore need a way to pass a parameter to the script so that it knows which DCI to search for. Is there a way to do this - maybe a parameter to main()? I was planning on including a string in the calling DCI's name that I can extract and construct the DCI name to search for, but as $dci is not set I cannot use this approach.
Here's the code of what I'm trying to do (obviously not working because of $dci).
sub main()
{
    array inValues;
    array outValues;
    collectionPeriod = 24 * 60 * 60;

    // Calculate the DCI name dynamically based on the name of the DCI object calling us.
    // $dci->name should be formatted "<sometext>: <interfacename>" (the ": " is important and must be unique).
    InputPrefix = "Input Bandwidth (bps) on ";
    OutputPrefix = "Output Bandwidth (bps) on ";
    WANname = "";
    if (index($dci->name, ": ") > 0)
        WANname = substr($dci->name, index($dci->name, ": ") + 2);

    // Get DCI's for input/output
    inDCIid = FindDCIByDescription($node, InputPrefix . WANname);
    outDCIid = FindDCIByDescription($node, OutputPrefix . WANname);

    // If DCI ID was determined, obtain array of all values for the past "collectionPeriod" seconds
    if (inDCIid > 0)
        inValues = GetDCIValues($node, inDCIid, time() - collectionPeriod, time());
    if (outDCIid > 0)
        outValues = GetDCIValues($node, outDCIid, time() - collectionPeriod, time());

    // Get the 95th percentile reading for each array
    in95th = calc95th(inValues);
    out95th = calc95th(outValues);

    // Utilisation is the max of any of the calculated 95th percentile values
    utilisation = max((in95th != null ? in95th : 0),
                      (out95th != null ? out95th : 0));

    return utilisation;
}
I guess I could create a script for every single interface, but that's a pain to maintain.
Rich
Hi,
I want to read the DCI's name from a script, and I've seen other posts referencing the $dci->name (or similar) variables. But when I attempt to access $dci my script was crashing. Very basically, I was trying to execute trace(1, "dciname=".$dci->name);
To test this I created a very simple script in the script library:
sub main()
{
if ($dci == null)
trace(1, "dci is null");
else
trace(1, "dci is not null");
}
I then created a DCI on an existing router node, set the type to "script" and selected the above script.
In my logs it shows "dci is null".
How can I get the DCI's name from within my script.
I'm running v2.1 on Windows.
Thanks,
Richard
Hi,
I have an issue when trying to graph a period of time over 1 week long. I collect DCI's per minute and when I attempt to graph more than 1 week I get timeouts from the client:
* Cannot get value for DCI routername:"Input Bandwidth on GigabitEthernet1/0/1" (Request timed out)
I'm running MariaDB 10.1 on Windows Server 2012 R2 and NetXMS 2.0.4 all on one box.
I migrated (~3 months ago) from MSSQL 2010, where the DB was on our corporate cluster offbox. Didn't have the issue with this setup.
This graph has 4 series (in/out for primary/secondary link) so I appreciate there is a lot of data. What I want to know is:
a) Is there a way to increase the timeout in the client?
b) Is there a performance tweak I can do with MySQL/MariaDB that will resolve these issues?
Sometimes if the period is not too long it gets the data after a refresh, presumably due to cache, but longer periods just refuse to graph.
Thanks,
Richard
Thanks Victor. Just did an upgrade to 2.0.4 (which was surprisingly easy) and it's all good now.
Rich
Anyone?
Is there a way to refresh the description that was generated during the instance discovery script?
We've updated our interface descriptions on the switches and I want them to be reflected in the DCI's that were discovered a long time back, but I don't want to delete the DCI's and lose their history.
Running version 1.2.17.
Rich
Hi guys,
I have a 1.2.17 installation sucessfully running for about a year now. This weekend our DB server had a non-critical failure which recovered after some minor maintenance. I saw in the NetXMS console the queues for Database writer, IData and Raw DCI values were high (~10m combined). After the DB was back up I saw the Database writer queue gradually reduce to zero, then the database writer (raw DCI values) queue reduce to zero, but the IData queue kept increasing. At this point I was still missing DCI data from for the weekend which I had hoped would catch up.
I left it for a while but in the end I restarted the NetXMS core service and everything is now working fine, but I lost this weekends worth of data. IData queue is now zero again.
Is there any way to force a DB reconnect / resync without restarting the NetXMS core (and thus losing the data)?
I'm using MSSQL 2010 for the DB and Windows 2008R2 for the NetXMS server.
Thanks,
Richard
Hi Victor,
Yes I changed it in communication properties. The default community was left alone (I have a number of other nodes using the default and any new ones will use the default). I disabled all the old communities on the device and changed to the new one. In fact, the when NetXMS attempts to use the old one it gets no response and the DCI's all move to a deactive state. The sequence of events seems to be as follows:
At this point, I tried doing some polls:
5a. Topology poll partially works. VLAN list is retrieved but the next query fails. I see auth errors, so assume old community is partially being used
5b. Interface names poll works. After I did this, the communications properties now shows the new community (topology poll still fails though)
5c. Configuration poll succeeds.
5d. Status poll succeeds.
I then left it for another while (30+ mins) and the old community is showing in the communications properties.
It may be that the right community is stored in the DB, but I opened the properties at some point and clicked OK, saving the old community and breaking things. So somewhere the old community is being stored.
Interestingly, I made two community changes to a device and the same thing occurred, except it kept reverting to the previous value. This at least showed that it wasn't reverting to the default community, but in fact the previous value of community.
Rich