
This worked great thanks Victor. 
Cheers!
This worked great thanks Victor.
Cheers!
Also getting script error Alarm. Pls view attached screen shot.

Here you go. Thanks a lot for your time
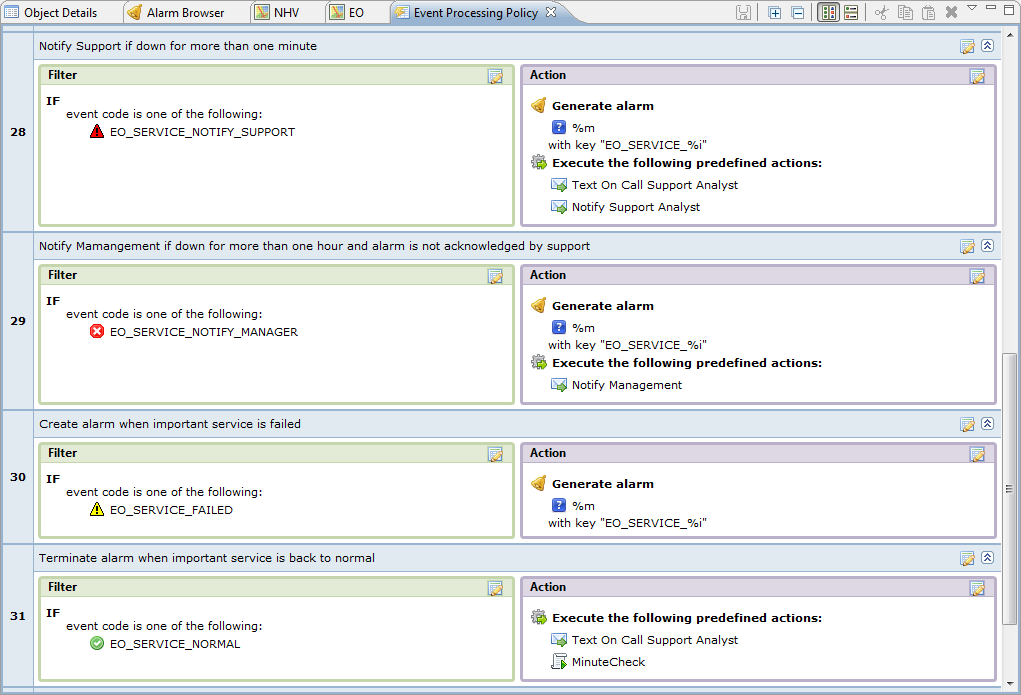

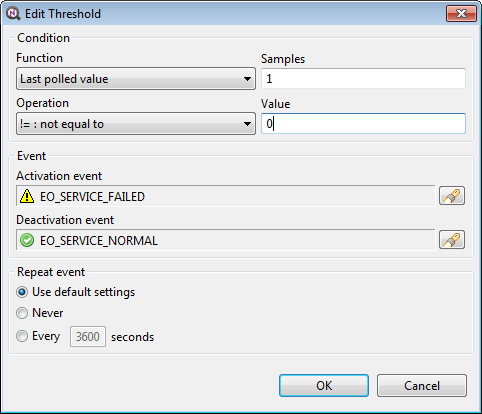
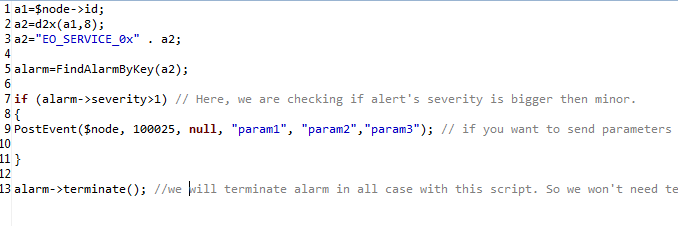
I tried your suggestions and ran into a couple of issues.
After waiting the minute an email is sent out. When the service come back up and alert is sent and alarm is cleared like it is supposed to BUT email alert says [0] CLIENTSERVER01: param2 and not the normal info i would normally get.
When the service goes down and goes back up before the 1 minute email alert is sent. Another email is sent showing [0] CLIENTSERVER01: param2 even though an alert has not even been sent showing it is down.
GOAL: My goal is to be able to scan for a service like MSSQLServer and get a report back on all servers running that service.
I created a DCI table (Services) and applied it to all server nodes. I would like to run a DCI summary table or a Dashboard to scan for a certain service running across all servers in my environment.
I thought a DCI Table for services would collect all services running. Next would be a DCI Summary Table or Dashboard to run across the whole Infrastructure Services. Then I can take that info and make sure the proper templates are being applied.
What would be the best way to accomplish this? Any ideas would be awesome.
Thanks Guys!
@victor said in NetXMS 2.0-RC1 released:
Hi,
we just updated Windows installers and source package with new build that contain a fix. File names are the same, but after install you should see build number 8036 for server binaries. Debian repository will be updated in a few hours.
Best regards,
Victor
I'm running on version 2.0 RC-1 8035 and I am trying to get the server to version 8036 as mentioned above. Is there another download spot that this is stored? I went to https://www.netxms.org/download/ - SERVER BINARIES and downloaded the file with the same name "netxms-2.0-RC1-x64.exe"
After I run that install again it still shows 8035 when starting the management console. What am I doing wrong?
Thanks a lot for the info. Unfortunately have not tried it yet due to my schedule. I just wanted to thank you for your input and I will update this thread with my results.
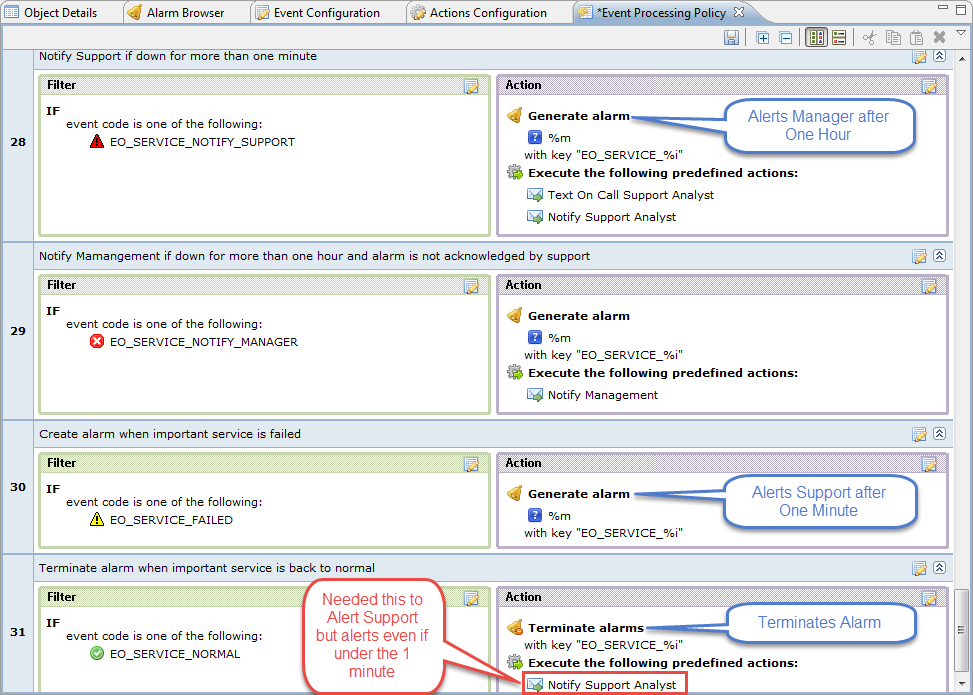
I setup the Problem Escalation per this youtube video - https://www.youtube.com/watch?v=KVV6R1RwKjc
In my test scenario when the service goes down it alerts Support after 1 minute and if not acknowledged after 1 hour is will alert the manager.
I got this to work just fine but the only problem is that the support team is not notified when the service is back up. It will terminate the alarm when it receives the APP_NORMAL event but does not notify support unless I create a server action in the "APP back to normal" event process. The issue with that is if a service goes down and is back up within the 1 minute it will still send out the alarm to support that it is "APP Back to Normal" when they have not been notified its even down yet.
I attached a screen shot.
I would like to only recieve an alert when the "Node is down" and not the "SNMP agent is not responding".
Currently I recieve 2 Alerts if a Node that is monitored with SNMP goes down. I would like to just recieve the one Node Down alert.
I have searched the forums on this to see if I could answer this myself.
Thanks Guys!
Does anyone have any ideas on what I'm doing wrong? I messed with it a little more and had no luck with my testing.
Thanks in advance guys!
Some reason that script is not working. I included screen shots maybe I have something wrong.
When I change the scrpit to the one I used prior and it locates all the drives. That script is below.
if (rindex($1,":")>0)
{
// if(length($1)>3) return false;
if (rindex($1,"A:")>0) return false;
value = AgentReadParameter($node, "FileSystem.Total(" . $1 . ")");
return (value != null) && (value > 0);
//return %(true, $1);
}
return false;
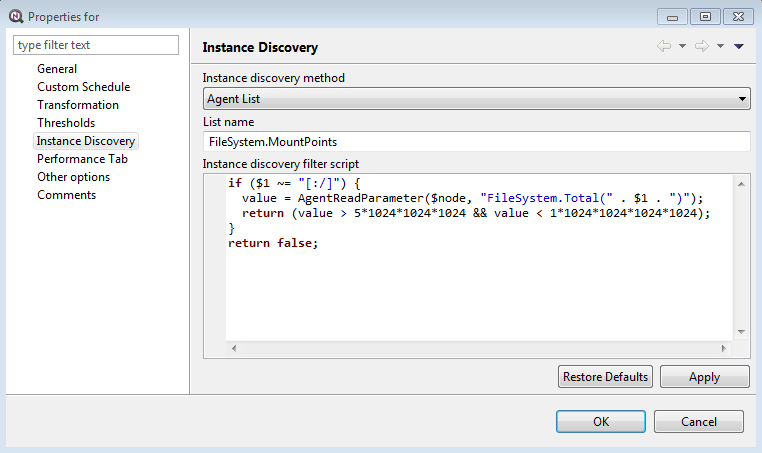
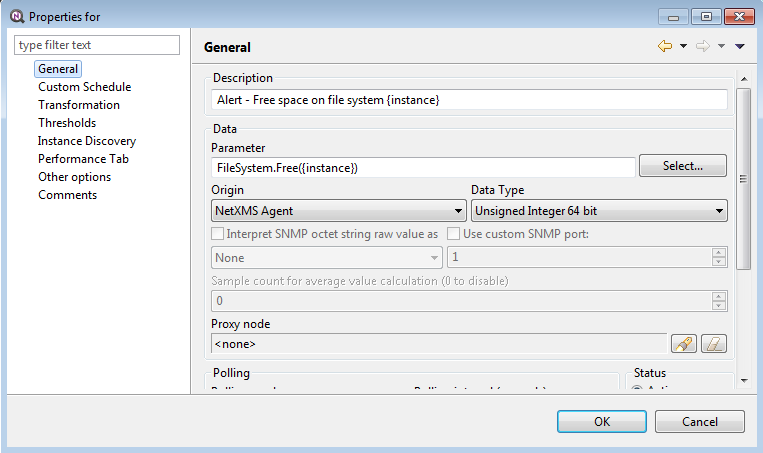
The post below shows what I would like to accomplish. I want the status “node down” to happen only after 2 polls and not on the first poll. Per the post below you said I have to change the "required poll count" for node interface(s) to desired number of polls.
Now when I look through server settings I do not see that. Would the “PollCountForStatusChange” be the same setting?
https://www.netxms.org/forum/configuration/'node-down'-alarm-could-appears-after-3-or-5-bad-status/
Is there a way to run the DCI Summary table on all server nodes from excel? I tested running a query on NetXMS from within excel and was able to.
Currently I export the data from the DCI Summary Table to excel and run custom reports on drive space needs. Just looking for away to automate this process and will be looking into the reporting addon of NetXMS as well.
Any Ideas? I'm running Version 2.0-M1 on Windows Server 2008r2. Do I need to upgrade to M2 for the script you provided to work? I'm waiting for M3 to be tested more before I upgrade to that version.
I tried your suggestion and it did not work for me. Currently I'm using a filter script to ignore CD/DVD drives that report as errors when there is no disk inserted as well as system partitions with no drive letter. I got the script from this post please review below.
CURRENT SCRIPT
if (rindex($1,":")>0)
{
// if(length($1)>3) return false;
if (rindex($1,"A:")>0) return false;
value = AgentReadParameter($node, "FileSystem.Total(" . $1 . ")");
return (value != null) && (value > 0);
//return %(true, $1);
}
return false;
SO for the DCI I created I removed the current script I use and I tried your suggestion and it located all drives and didn't filter anything.
NEW SCRIPT
if ($1 =~ "[:/]") {
  value = AgentReadParameter($node, "FileSystem.Total(" . $1 . ")")
  return (value > 5*1024*1024*1024 && value < 1*1024*1024*1024*1024);
}
return false;
For the values you suggested (5*1024*1024*1024) is for 5GB I asume and (1*1024*1024*1024*1024) is for 1TB. If I understand this right, if I wanted to filter drives that are 500GB to 1000GB I would use (value > 512*1024*1024*1024 && value < 1*1024*1024*1024*1024) Not sure on this and hope its not a stupid question.
Guys,
I'm looking to create a script that will only show drives within a certain size range. For example only show drives that are between 500Gb and 1,000GB or 1,000GB and 1,500GB.
The reason being is that i want to setup thresholds differently on drives. Smaller drives i would like to have a higher percentage free than huge drives. The bigger the drive gets the lower i want the percentage free to alert on the threshold.
I currently have 113 Server reporting
Just want to share how I got my issue resolved. I created Tabled DCIs on a template that applied to all server nodes. I created Tabled DCIs for FileSystem.Volumes, System.InstalledProducts, System.Processes and System.Services.
So I removed the Table DCIs from all nodes it was applied to and have not had an issue since. I think I should have changed the polling time from 60 sec to something less frequently, since its pulling so much info each poll.
The CPU is back to normal as well. I liked the Table DCIs but not sure if this is ready or I just configured it wrong.
Thanks!
I have NetXMS running on a Windows Server 2008r2 and having an issue since I updated to version 2.0-M1.
What seems to happen after a day of running, it will be maxed out on RAM and CPU. When this happens the notifications go crazy constantly poping up in task bar. Notification shows ("NODE NAME": Node status changed to WARNING) it will say warning, minor, major or critical and flashes quickly.
Within the NetXMS console the HEAP size at the bottom is jumping up and down.
Any ideas on this? Will updating to 2.0-M2 fix this issue? Looks like the change log shows that this version addresses a NetXMS crashing on some versions of Windows.
Thanks in advance!!
Hi Victor,
Thanks for the reply! When will that version 2.0-M3 be available?
Thanks!