Skip to content
  • Categories
  • Recent
  • Tags
  • Popular
  • Users
  • Groups
Skins
  • Light
  • Brite
  • Cerulean
  • Cosmo
  • Flatly
  • Journal
  • Litera
  • Lumen
  • Lux
  • Materia
  • Minty
  • Morph
  • Pulse
  • Sandstone
  • Simplex
  • Sketchy
  • Spacelab
  • United
  • Yeti
  • Zephyr
  • Dark
  • Cyborg
  • Darkly
  • Quartz
  • Slate
  • Solar
  • Superhero
  • Vapor

  • Default (Flatly)
  • No Skin
Collapse
Brand Logo

NetXMS Forum

T

TBacker

@TBacker
Unfollow Follow
About
Posts
2
Topics
1
Shares
0
Groups
0
Followers
0
Following
0

Posts

Recent Best Controversial

  • Line Graph X-Axis Labels
    T TBacker
    Support

    Sorry for the slow response - the "one guy doing 5 jobs" syndrome...
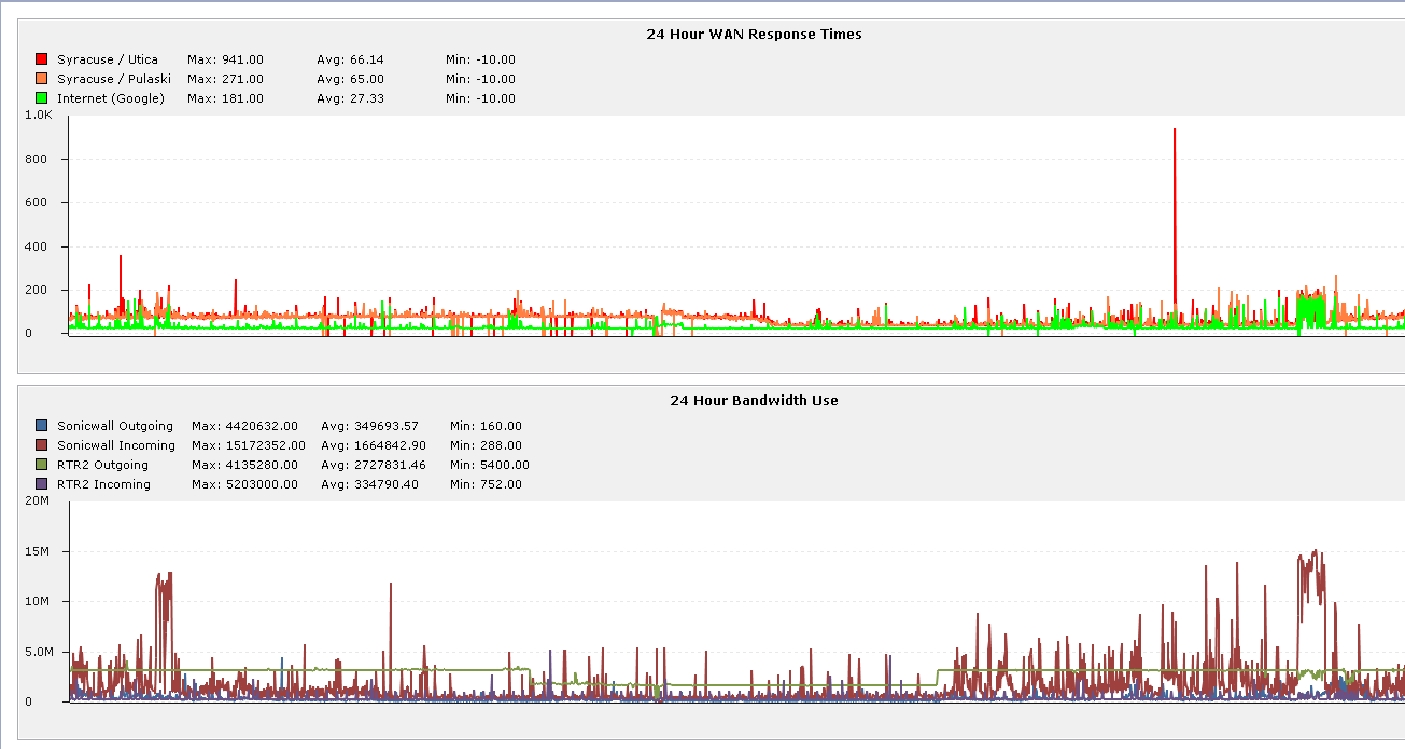

    Screencap.JPG


  • Line Graph X-Axis Labels
    T TBacker
    Support

    I'm running NetXMS version 1.2.11.

    I have a few traffic graphs made up for dashboards so that I can see any issues over a 24 hour period.  My problem is that, no matter how I configure them, I cannot get the time scale/hashmarks to display along the bottom (X-Axis). 

    I understand it's a long time period, but I would expect NetXMS to auto-scale the text and hashmark spacing to a reasonable level and display it.

    I also looked through the xml and see no options for this.

    Am I missing something?

  • Login

  • Don't have an account? Register

  • Login or register to search.
Powered by NodeBB Contributors
  • First post
    Last post
0
  • Categories
  • Recent
  • Tags
  • Popular
  • Users
  • Groups