
Thanks Victor. This works like a charm.
Iliyan
 V
Thanks Victor. This works like a charm.
Iliyan
Hi,
I'm trying to do simple math calculations in order to show correct used disk space. The value I'm taking it from SNMP and then I'm doing a simple transformation as follows:
sub main()
{
	return 4096 * $1 / 1099511627776;
}
For example when $1 is equal to 1265236238 (which is actual value in my case), the result should be similar to 4.7133.
However it shows -0.001384
So my question is, how the hell did I get this value?
Cheers,
Iliyan
Hi,
I've upgraded to version 1.2.14 and since then the netxmsd daemon uses above 100% CPU resources (more than 1 core). There are no crashes, though, just high load. Attached some debug information. I hope it be useful to debug the problem.
Regards,
Iliyan
Hi,
Well, to tell you first, there's no easy way to accomplish this as VMWare doesn't monitor hardware status they we want to. You can try to enable monitoring on the hardware via CIM. You can follow this link to understand how to add LSI support on ESXi -> (http://www.thomas-krenn.com/en/wiki/Monitoring_LSI_RAID_Controllers_in_VMware
Then, only if you're using vCenter Server, you can test in case of hardware failure if an SNMP trap has been produced. If it does, then you can redirect all SNMP traps to the NetXMS server and create alarms.
Mikrotik MIB which I use to monitor my Mikrotik routers - health, hotspot info, wireless status, etc.
You've got a message. 
This could be easily achieved via SNMP. If you're running Linux you can setup network counters in NetFilter like:
# WEB Traffic
iptables -I FORWARD -s $localnet -d 0/0 -p tcp --dport 80
iptables -I FORWARD -s 0/0 -d $localnet -p tcp --dport 80
After that you can see something like (for the purpose of example I'm using INPUT chain):
root@green:~# iptables -L INPUT -n -v
Chain INPUT (policy ACCEPT 1265 packets, 181K bytes)
pkts bytes target prot opt in out source destination
170 30091 tcp -- * * 0.0.0.0/0 0.0.0.0/0 tcp dpt:80
root@green:~#
Whit a little help of AWK you can make a script that will get bytes value:
Create a file.sh and put that command in it. After that extend your SNMP functionality by adding a line like such in snmpd.conf:
extend webtraf /bin/sh /path/to/file.sh
Don't forget to restart your snmpd. Then call snmpwalk:
snmpwalk -v 2c -c community IP.ADD.RE.SS iso.3.6.1.4.1.8072.1.3.2.4.1.2
It should return something similar to
iso.3.6.1.4.1.8072.1.3.2.4.1.2.7.119.101.98.116.114.97.102.1 = STRING: "313K"
And voila - this is the web traffic counter. After that you can easily create DCI with SNMP and put this OID to get the value.
I hope you've got the idea
I guess there are other ways of getting that traffic but I can't think of any right now.
Cheers,
Iliyan
Well, that network drive before even become network is a local for a machine. You can check that computer for a storage space by either using nxagent or SNMP.
If that's not possible you can always attach the network drive to a computer and check it there.
First of all, thank you for unlocking the topic.
The AT NDD driver seem to work only partially.
For GS950/48 I was able to see the switch port presentation (see on the attachment) however VLAN table is not shown correctly (it's empty). The correct OID that will collect VLAN information is .1.3.6.1.4.1.207.8.33.8. It will show this data:
# snmpwalk -c ******** -v 2c 10.7.0.6 .1.3.6.1.4.1.207.8.33.8
iso.3.6.1.4.1.207.8.33.8.1.1.1.1 = INTEGER: 1
iso.3.6.1.4.1.207.8.33.8.1.1.1.102 = INTEGER: 102
iso.3.6.1.4.1.207.8.33.8.1.1.1.400 = INTEGER: 400
iso.3.6.1.4.1.207.8.33.8.1.1.2.1 = STRING: "Default VLAN"
iso.3.6.1.4.1.207.8.33.8.1.1.2.102 = STRING: "WiFi"
iso.3.6.1.4.1.207.8.33.8.1.1.2.400 = STRING: "Newell"
iso.3.6.1.4.1.207.8.33.8.1.1.3.1 = INTEGER: 1
iso.3.6.1.4.1.207.8.33.8.1.1.3.102 = INTEGER: 102
iso.3.6.1.4.1.207.8.33.8.1.1.3.400 = INTEGER: 400
iso.3.6.1.4.1.207.8.33.8.1.1.4.1 = STRING: "1-2,4,6-16,22,25-48"
iso.3.6.1.4.1.207.8.33.8.1.1.4.102 = ""
iso.3.6.1.4.1.207.8.33.8.1.1.4.400 = STRING: "3,5,17-21,23-24"
iso.3.6.1.4.1.207.8.33.8.1.1.5.1 = ""
iso.3.6.1.4.1.207.8.33.8.1.1.5.102 = STRING: "16,47"
iso.3.6.1.4.1.207.8.33.8.1.1.5.400 = ""
iso.3.6.1.4.1.207.8.33.8.1.1.20.1 = INTEGER: 2
iso.3.6.1.4.1.207.8.33.8.1.1.20.102 = INTEGER: 2
iso.3.6.1.4.1.207.8.33.8.1.1.20.400 = INTEGER: 2
iso.3.6.1.4.1.207.8.33.8.2.1.1.1.1 = INTEGER: 1
iso.3.6.1.4.1.207.8.33.8.2.1.1.1.2 = INTEGER: 1
iso.3.6.1.4.1.207.8.33.8.2.1.1.1.3 = INTEGER: 1
iso.3.6.1.4.1.207.8.33.8.2.1.1.1.4 = INTEGER: 1
iso.3.6.1.4.1.207.8.33.8.2.1.1.1.5 = INTEGER: 1
iso.3.6.1.4.1.207.8.33.8.2.1.1.1.6 = INTEGER: 1
iso.3.6.1.4.1.207.8.33.8.2.1.1.1.7 = INTEGER: 1
iso.3.6.1.4.1.207.8.33.8.2.1.1.1.8 = INTEGER: 1
iso.3.6.1.4.1.207.8.33.8.2.1.1.1.9 = INTEGER: 1
...
...
With GS950/24 the problem is quite the opposite. There is now switch port information shown (PORT tab), however VLAN database is shown correctly (without port-to-vlan presentation).
If needed I can provide access to my NetXMS installation so you can perform any kind of tests you like. Just let me know.
Regards,
Iliyan
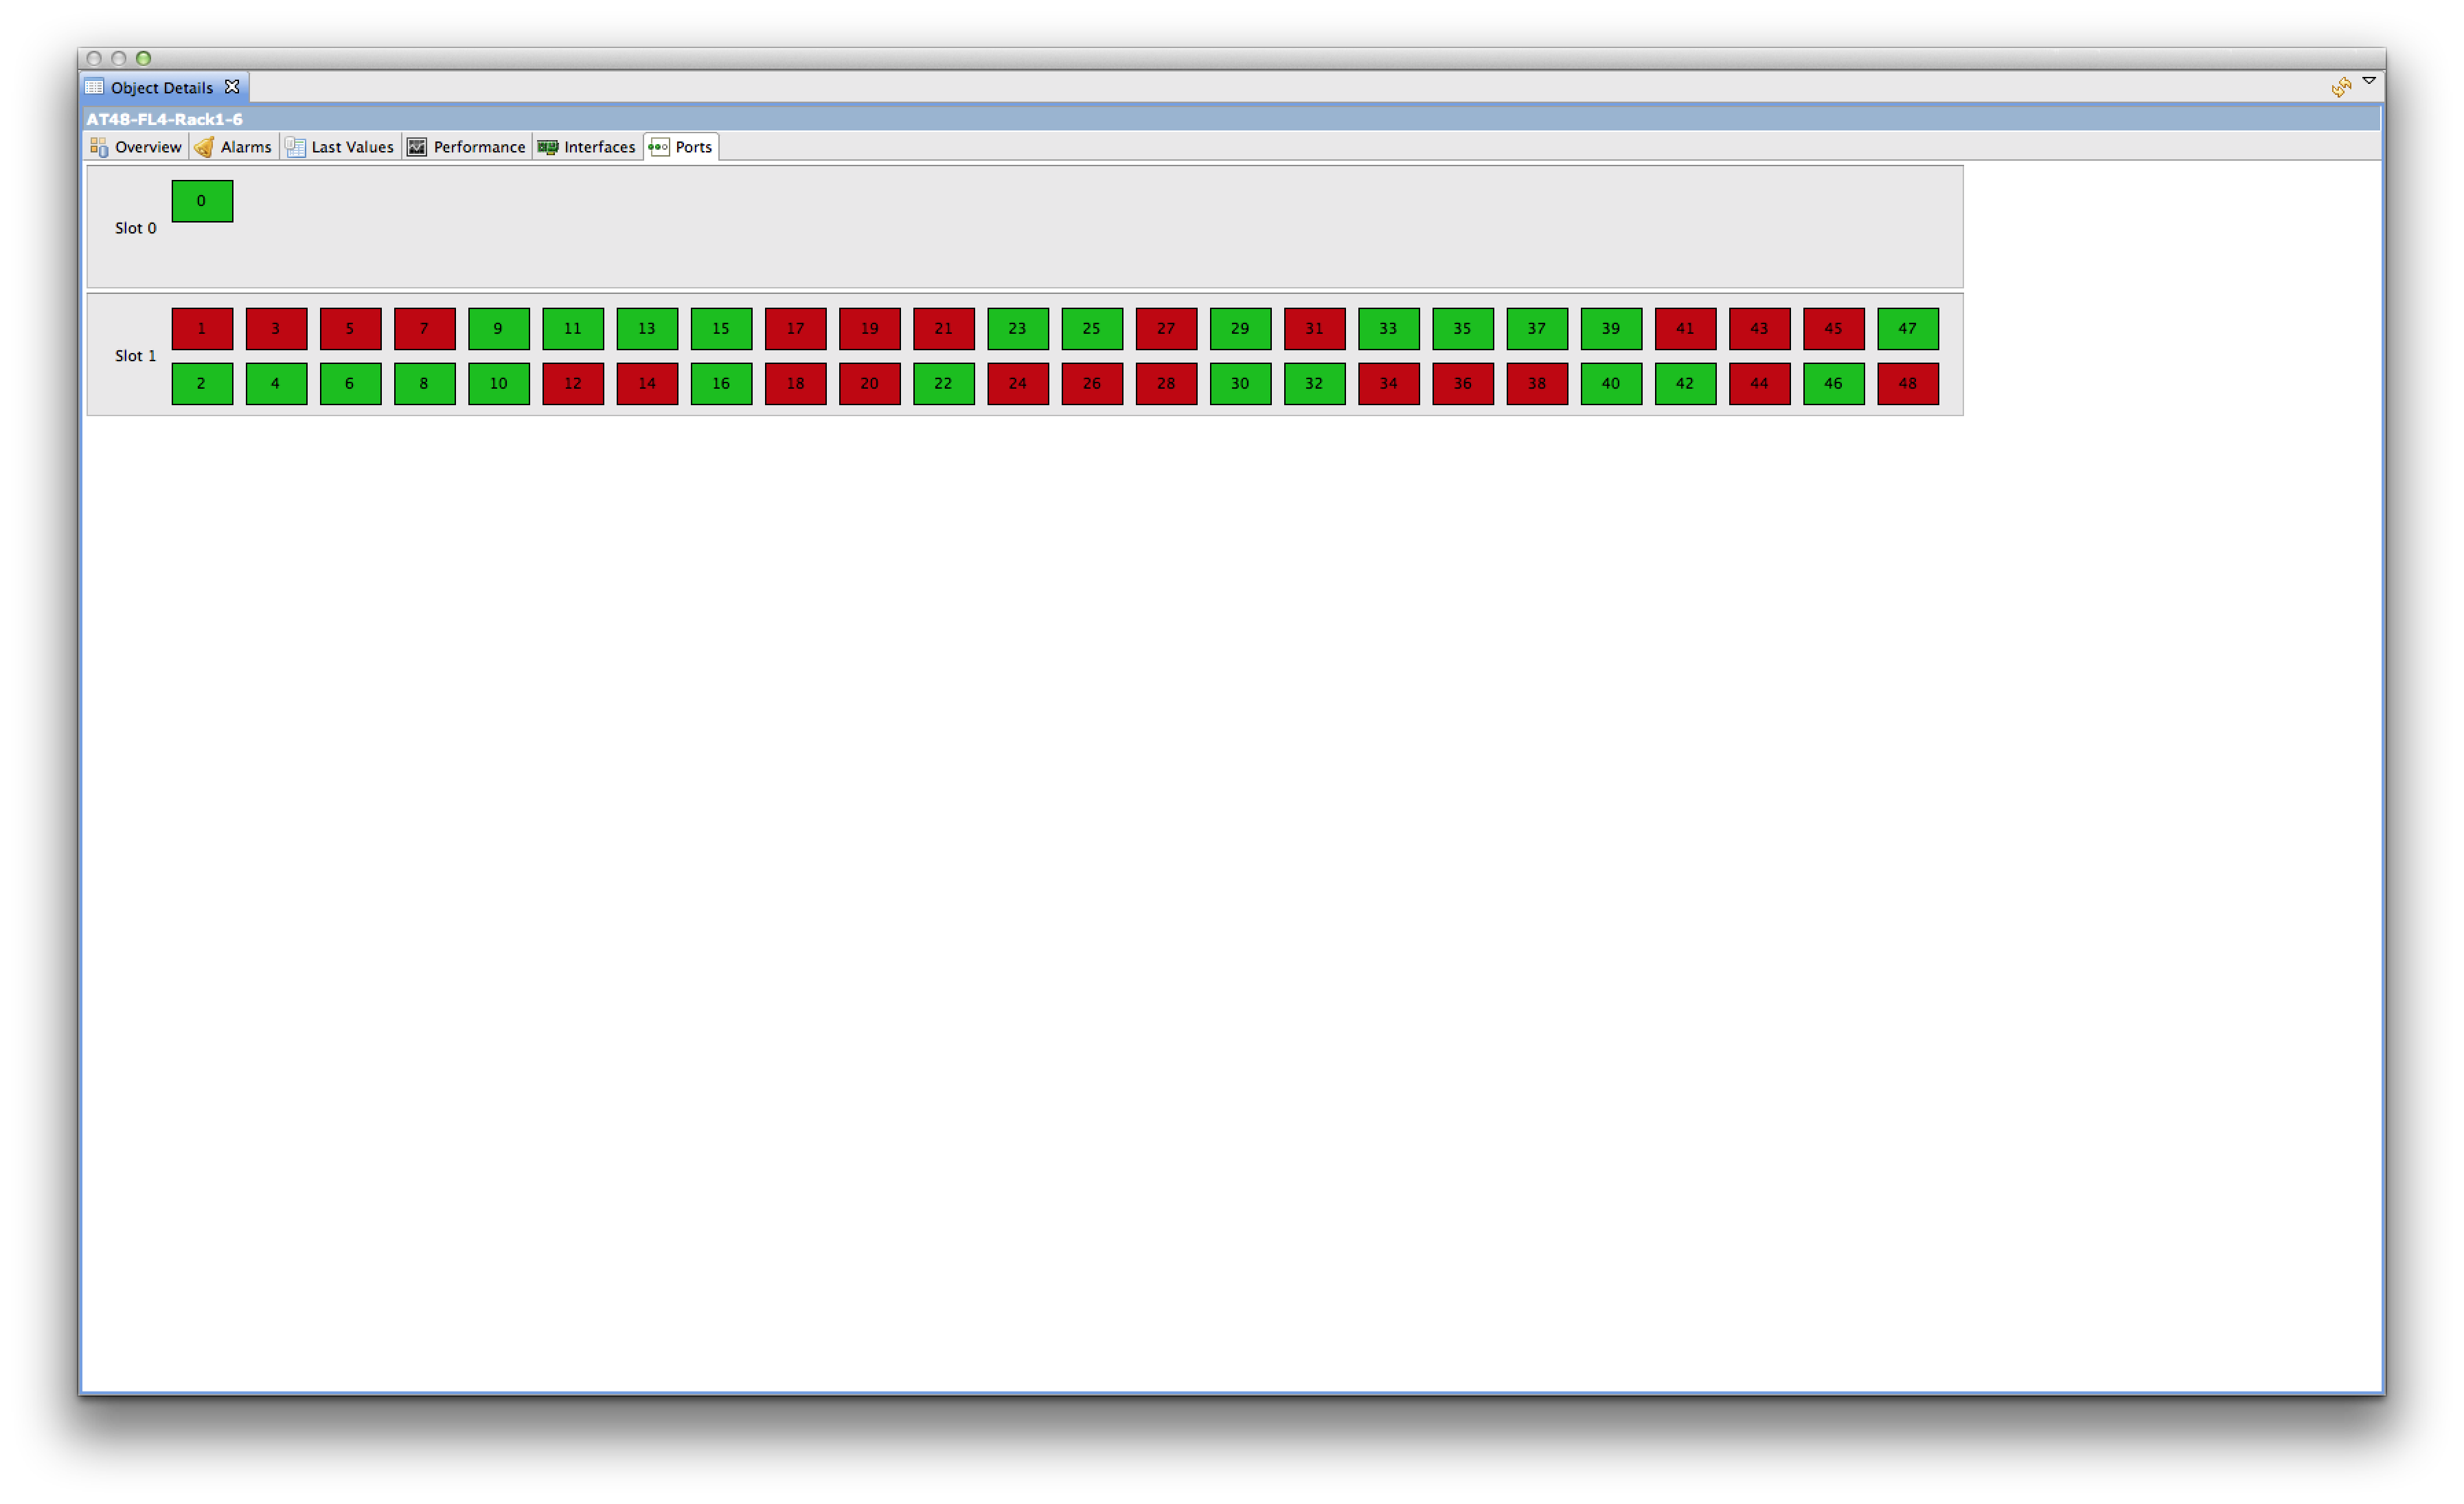
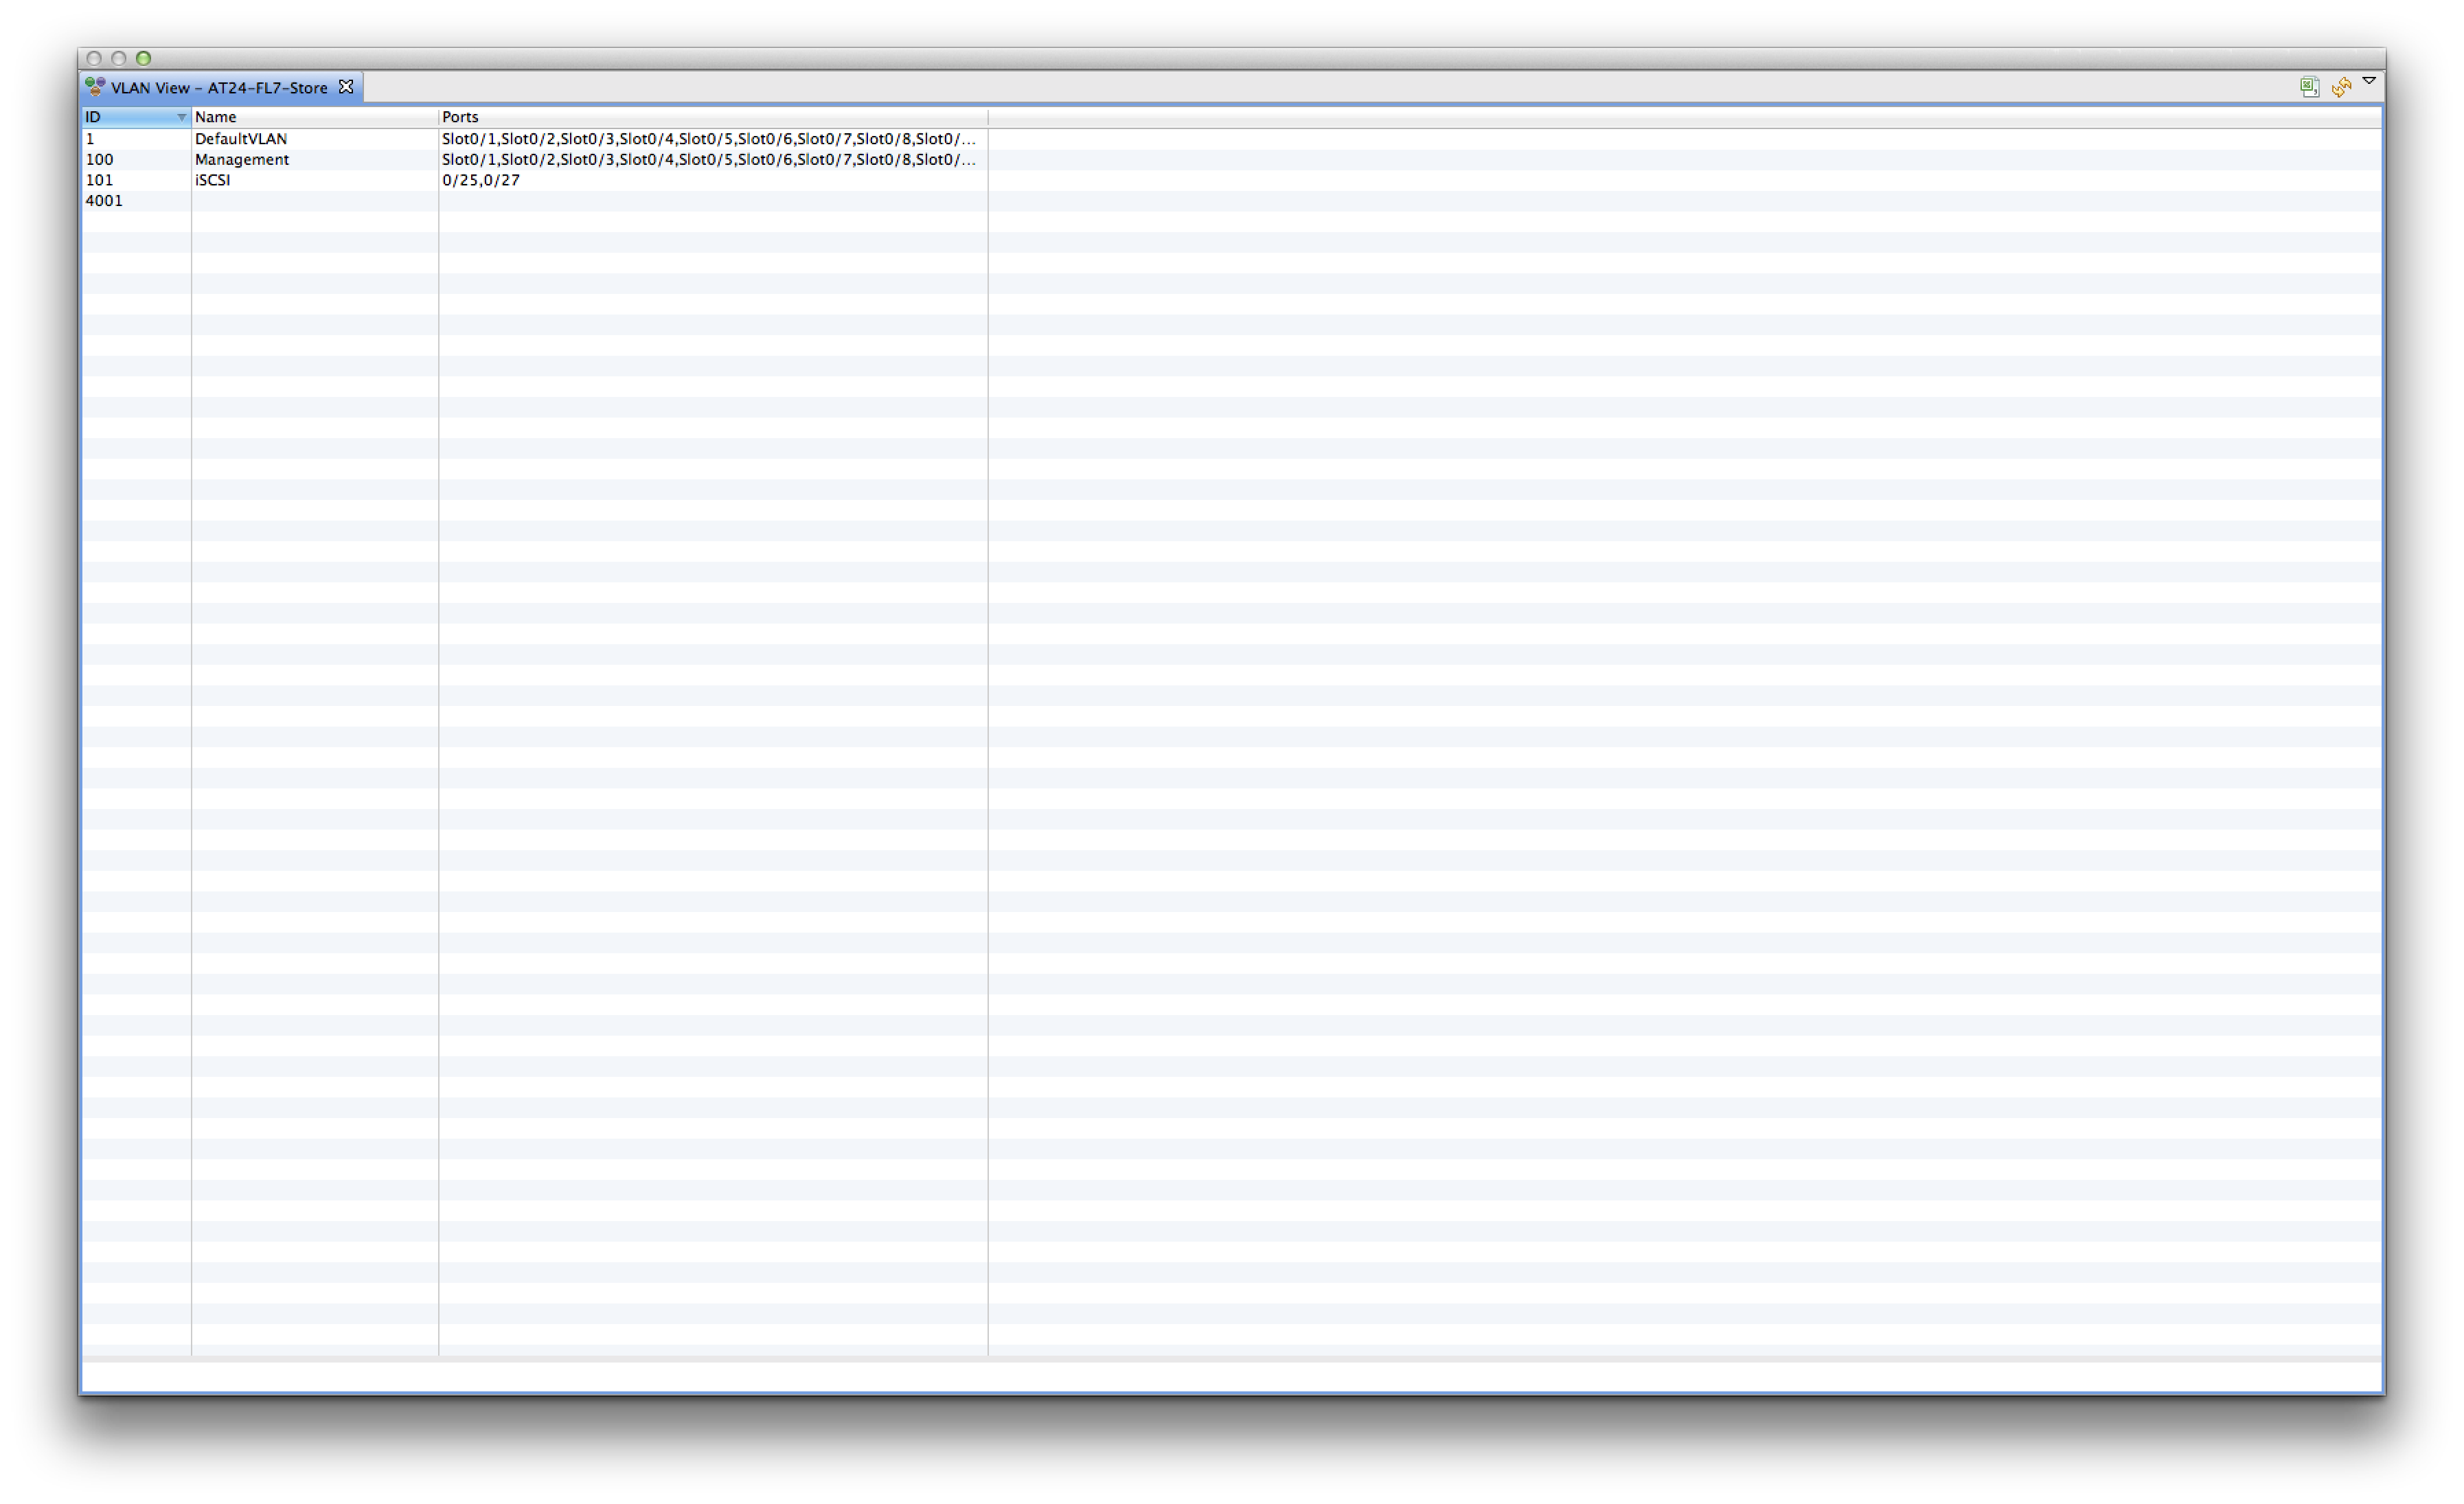
I'm looking forward to that.
Off-topic: Can you unlock https://www.netxms.org/forum/configuration/alliedtelesis-network-topology/msg10407/#msg10407 as I discovered that certain functionality is not working as it should and want to report it.
I would very much appreciate if there's an easy way of building NDD drivers for various devices. As far as I know NDD drivers are build based on SNMP MIB's for that particular device and if we can build them ourselves it will very much extend the functionality of NXMS
I've got the same error when I open netxms console on Mac.
Ive empty mib/ directory and then put back all the txt files from a fresh installation of Netxms. I even tried to completely reinstall the netxms server. Unfortunately I've got the same error. The problem started to appear right after upgrade from .10 to .11.
Looking forward or a solution on this.
EDIT: The problem doesn't occur when I tried web console.
Thanks. Btw, have you consider adding Mikrotik NDD as well?
This works as a charm. Thank you!
But then how can we measure the exact latency and/or packet losses if I use method 1?
I am trying to figure out how to check connection status to remote host (using PING to check latency and packet loss) without having agent installed on that host. One option, I am using now, is adding PING section in the agent's configuration on a local host to check the remote one, however I cannot measure uptime of the connection between me and the remote host as a Business Service.
I want to define NODE object for the remote host and add PING checks on it to check the latency and packet loss. Is there a way to do it?
Thanks in advance.
Iliyan
Have you created NDD's for AT switches yet? I am eagerly checking every ChangeLog since my last reply and haven't seen anything about AT.
Just sent you two emails, one for each device, with hints on the MIB files along with few screenshots.
I will send you similar information regarding other models of AT shortly.
Im looking forward to new NDD's.
Thanks,
Iliyan
How can I send you these MIB files because apparently I can't attach it here due to file size limits?
Also when I to "Pull Topology" I'm getting this:
[30.05.2013 10:15:43] **** Poll request sent to server ****
[30.05.2013 10:15:43] Poll request accepted
[30.05.2013 10:15:43] Starting topology poll for node AT48-FL4-Rack1-6
[30.05.2013 10:15:43] VLAN list successfully retrieved from node
[30.05.2013 10:15:46] Switch forwarding database retrieved
[30.05.2013 10:15:46] Link layer topology retrieved (0 connections found)
[30.05.2013 10:15:46] Updating peer information on interfaces
[30.05.2013 10:15:46] Link layer topology processed
[30.05.2013 10:15:46] Finished topology poll for node AT48-FL4-Rack1-6
[30.05.2013 10:15:46] **** Poll completed successfully ****