
Sharing Standard Templates for NetXMS
-
-
@harun said in Sharing Standard Templates for NetXMS:
Cisco template
- cpu load
- memory utilization
- hardware monitoring
I downloaded this template, successfully imported it into NetXMS (v3.4.178), and it's automatically applying to my Cisco 1841 ISR router, but there are no DCIs when the xml template gets imported. Any ideas?
-
This is bug in importing templates from export files generated by old versions of NetXMS server. I just fixed it and fix will be included into next patch release.
Best regards,
Victor -
@paul said in Sharing Standard Templates for NetXMS:
Well - here is the first cut of my Windows generic template. it includes the events that are triggered.
For explanation of the thresholds that apply in this template, they are implemented as per here:
https://www.netxms.org/forum/general-support/simple-question-cdm-monitoring-using-snmp-anybody-doing-this/msg25843/#msg25843For excluding CD drives in discovery you have to exclude UFS as well...
-
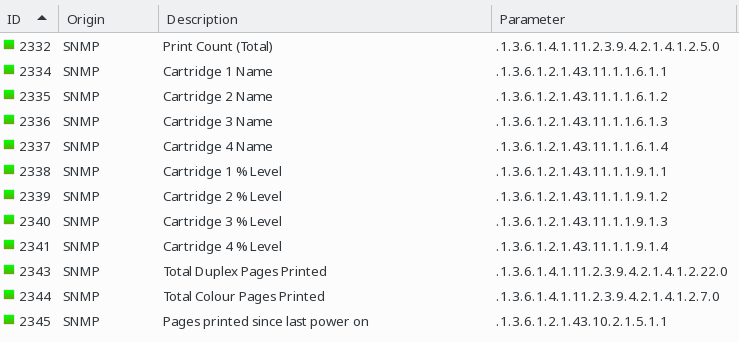
HP Color LaserJet Supply levels and page counts.
Note, this should also work for mono Lasers, but you might have to delete some DCIs.
I took the values from my HP Color LaserJet M254dwThe next thing to add to this would be to get the graphs to automatically display the right legend for each toner cartridge.
I tried to follow https://www.netxms.org/forum/general-support/is-it-possible-to-use-text-from-another-snmp-attribute-for-the-legend-on-graphs/msg30369/#msg30369, but still don't understand it
Let me know if you can think of any improvements as this is my first successful attempt

-
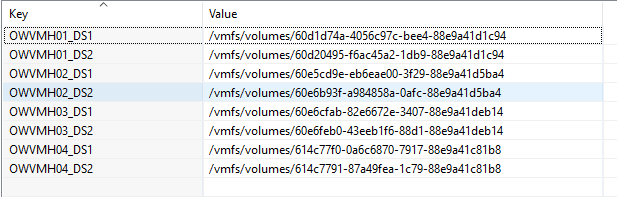
VMWare Memory, CPU and Storage
Don't ask about other values (IOPS, latency etc), as I haven't figured it out yet, and may require PowerCLI or something annoyingSee attached screenshots for examples.
To make things easier, add the datastore names as persistant storage keys and values.
You can then reference them in the scripts using the name rather than the annoyingly long mount points. Of course there's no easy way of finding out this in the first place, other than SSHing into the server and doing a "df", or looking in the vCenter DataStore sections. Datastore names are not queryable via SNMP as far as I can tell, which is lame.The template should auto apply, but once they have applied to your servers, you will need to add some DCIs manually using the included scripts to correctly deal with the datastores.
ThegetVMWareCPULoad(totalCPUUsage)is used to monitor total CPU usage for all cores, as with most VMWare servers, graphing individual CPUs will probably end up with a crazy graph with mainly black lines unless you can be bothered to find 32 different colours for your 32 cores
getVMWareCPULoadwill add up CPU usage from each core, and using
getVMWareCPULoad(totalCPUCountX100)can be used to get a line to show if all cores were using 100%.Hopefully this is useful. If you have any suggestions on how to add more useful metrics, please let me know!
Thanks

-
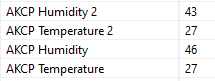
Applies to: AKCP sensorProbe2 https://www.akcp.com/akcp-products/sensorprobe-series/sensorprobe2/
Notes: Instance discover on attached sensors and grab name from device
-
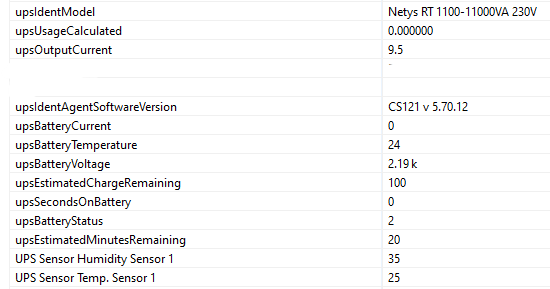
Applies to: UPS CS121/CS141 plugin module from Coromatic/Generex/++
Notes:
Instance discovery on attached sensors.
-
-
-
Hello! It looks like you're interested in this conversation, but you don't have an account yet.
Getting fed up of having to scroll through the same posts each visit? When you register for an account, you'll always come back to exactly where you were before, and choose to be notified of new replies (either via email, or push notification). You'll also be able to save bookmarks and upvote posts to show your appreciation to other community members.
With your input, this post could be even better 💗
Register Login