Skip to content
  • Categories
  • Recent
  • Tags
  • Popular
  • Users
  • Groups
Skins
  • Light
  • Brite
  • Cerulean
  • Cosmo
  • Flatly
  • Journal
  • Litera
  • Lumen
  • Lux
  • Materia
  • Minty
  • Morph
  • Pulse
  • Sandstone
  • Simplex
  • Sketchy
  • Spacelab
  • United
  • Yeti
  • Zephyr
  • Dark
  • Cyborg
  • Darkly
  • Quartz
  • Slate
  • Solar
  • Superhero
  • Vapor

  • Default (Flatly)
  • No Skin
Collapse
Brand Logo

NetXMS Forum

C

chidex

@chidex
Unfollow Follow
About
Posts
11
Topics
2
Shares
0
Groups
0
Followers
0
Following
0

Posts

Recent Best Controversial

  • ISP Connectivity Monitoring with ICMP
    C chidex
    Support

    Hi Filipp Sudanov

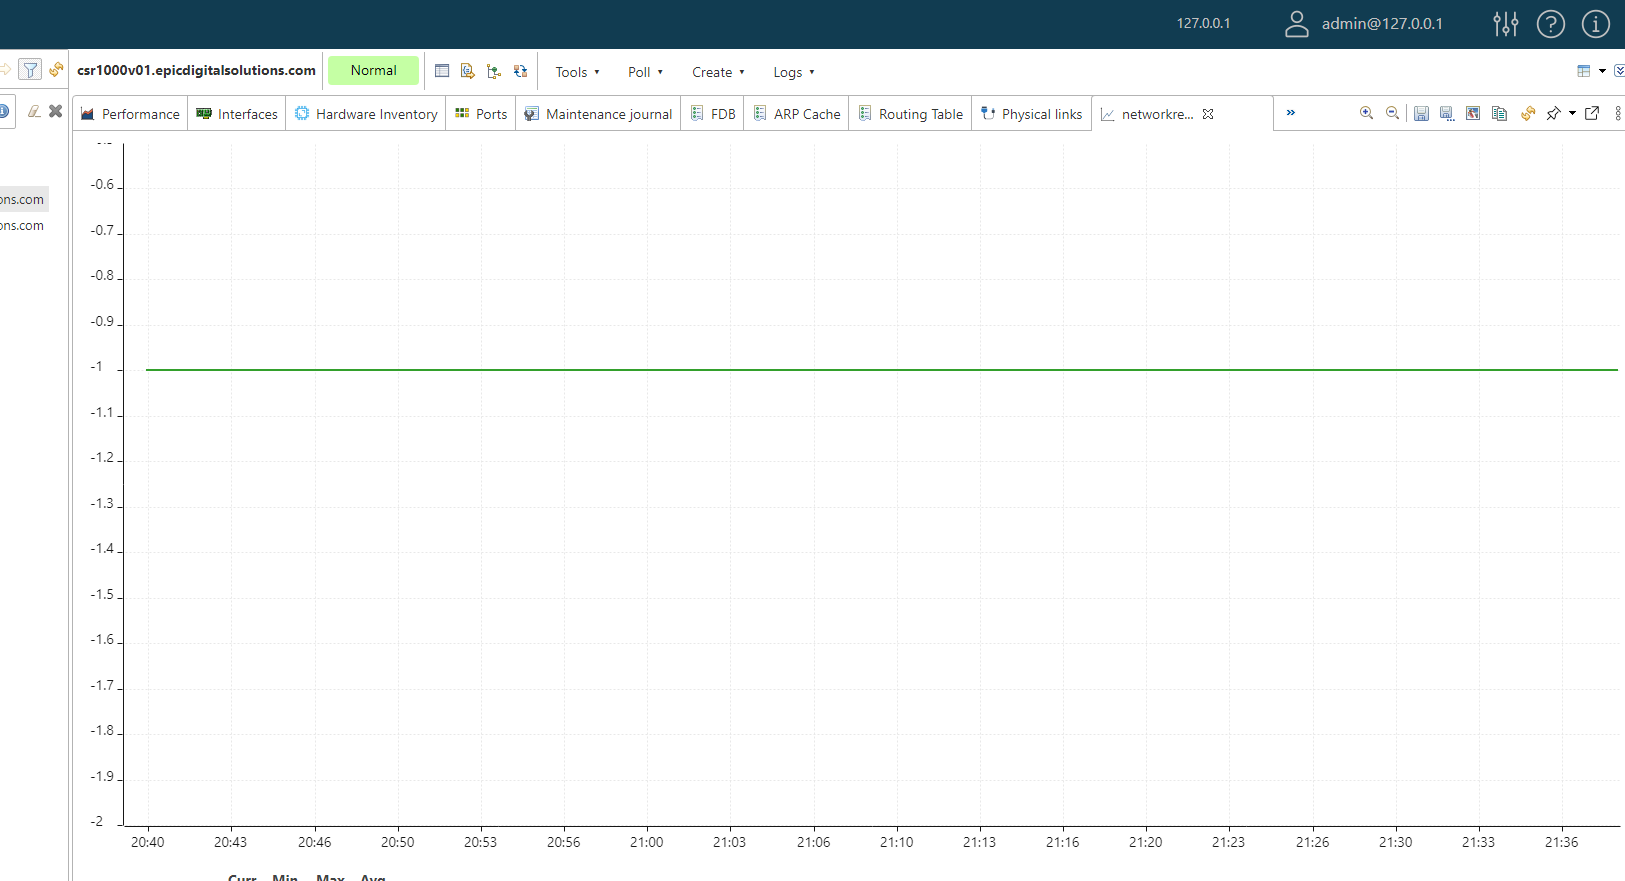
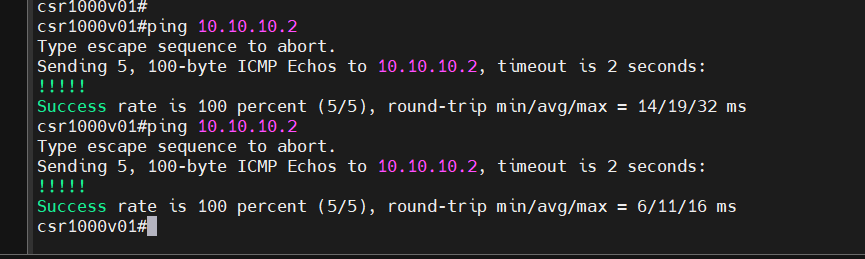
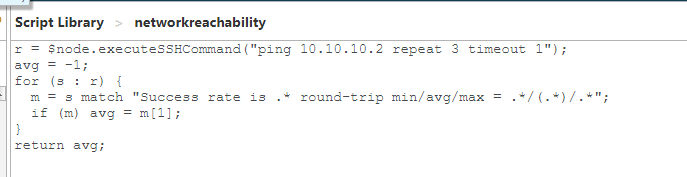
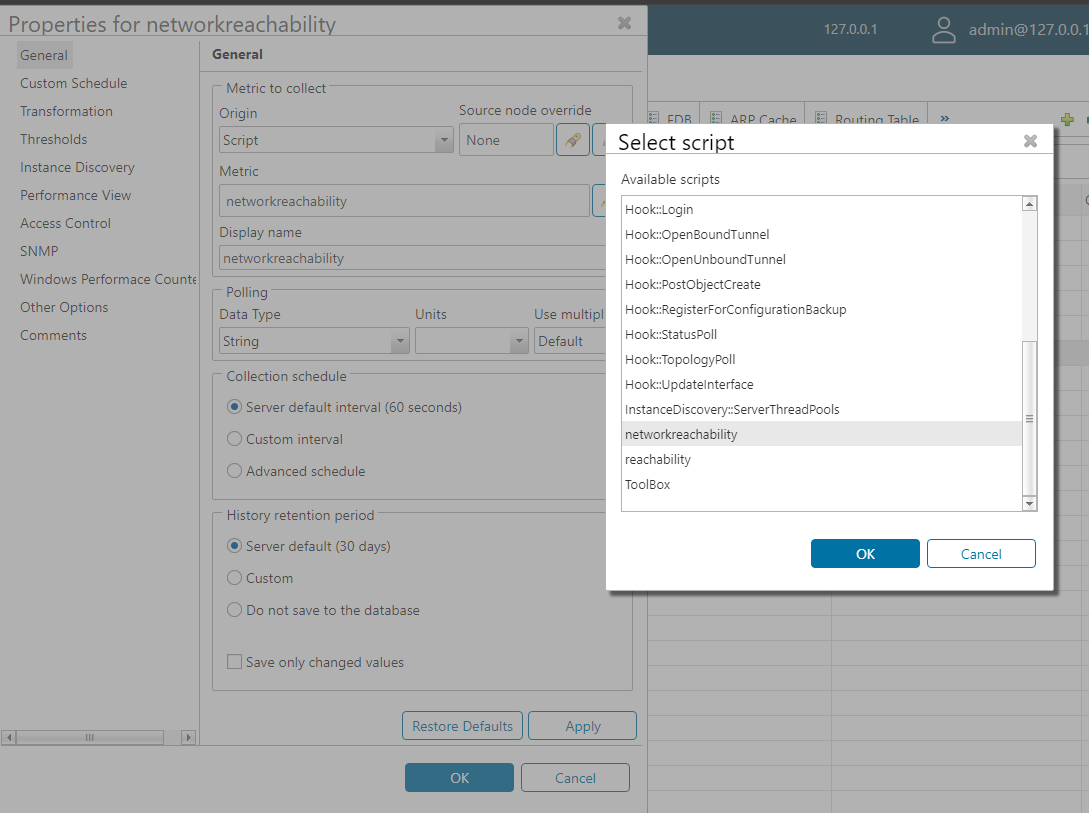
    I have tried this and am really stuck. Picture A is the script in the script library, Picture B is the script in the source router DCI. However the value has remained -1 regardless in picture C. Picture D shows I can reach the ip 10.10.10.2 from the source router and this is the ip in the script destination. IS there anything am missing?


    A.PNG

    B.PNG

    C.PNG

    D.PNG


  • Using Web API to retrieve NetXMS Alarm data in Grafana
    C chidex
    Support

    @zev said in Using Web API to retrieve NetXMS Alarm data in Grafana:

    There is new blog post about Grafana/NetXMS integration. Maybe object queries might help you with interface display options.
    Post:
    https://netxms.com/blog/grafana-configuraiton-in-netxms

    Wow, Wow..Thank you so much Tatjana Dubrovica. This is a life saver. I have struggled working with infinity plugin to get all the things I want. Though I have made a little progress, the blog post provides a lot more granular insight. I really do appreciate this..


  • Using Web API to retrieve NetXMS Alarm data in Grafana
    C chidex
    Support

    @zev said in Using Web API to retrieve NetXMS Alarm data in Grafana:

    First endpoint also just works without Grafana plugin (it just provides data in human readable way).

    Thank you for the support Tatjana Dubrovica. I have successfully retrieved the Alarms via API on grafana. I was wondering if I can do same to retrieve the following via API. Are there limitations? I cant find any clue on the API documentations.

    1. DCI
    2. Status Map
    3. Device interfaces as it is on NetXMS UI and hardware inventory
    4. Maps - the nice map showing real time statistics of link and interface states

    If not supported via API, can it be done by querying the postgres database directly?


  • ISP Connectivity Monitoring with ICMP
    C chidex
    Support

    @filipp-sudanov said in ISP Connectivity Monitoring with ICMP:

    It's probably taking the first line of the output that was obtained via ssh. In this case it's !!!!!, which might be interpreted as 0 if the DCI is Integer.
    If you check history for this DCI, raw value column might have some clue.

    if your router supports i command which allows to filter the output, you can do something like this:

    ping 8.8.8.8 repeat 3 timeout 1 | i Success
    

    This would limit the output just to one line, which then can be parsed using transformation script. Note that I limited number of requests and timeout as by default there's 4 second limitation between netxms server and agent - result should be returned within that time.

    If above is not possible, the other approach is to call ssh command from NXSL script. In this case all lines of output are received (as array) and we can parse this array to extract data:

    r = $node.executeSSHCommand("ping 8.8.8.8 repeat 3 timeout 1");
    avg = -1;
    for (s : r) {
      m = s match "Success rate is .* round-trip min/avg/max = .*/(.*)/.*";
      if (m) avg = m[1];
    }
    return avg;
    

    You can either put this script into script library and use it in Script DCI; or you can make Internal DCI with metric Dummy and put this into transformation script.

    Thank you soo much Filipi, Am going to test this and come back. I know am quite new to NetXMS and learning. I will try this out..Thank you

  • ISP Connectivity Monitoring with ICMP
    C chidex
    Support

    Hi,

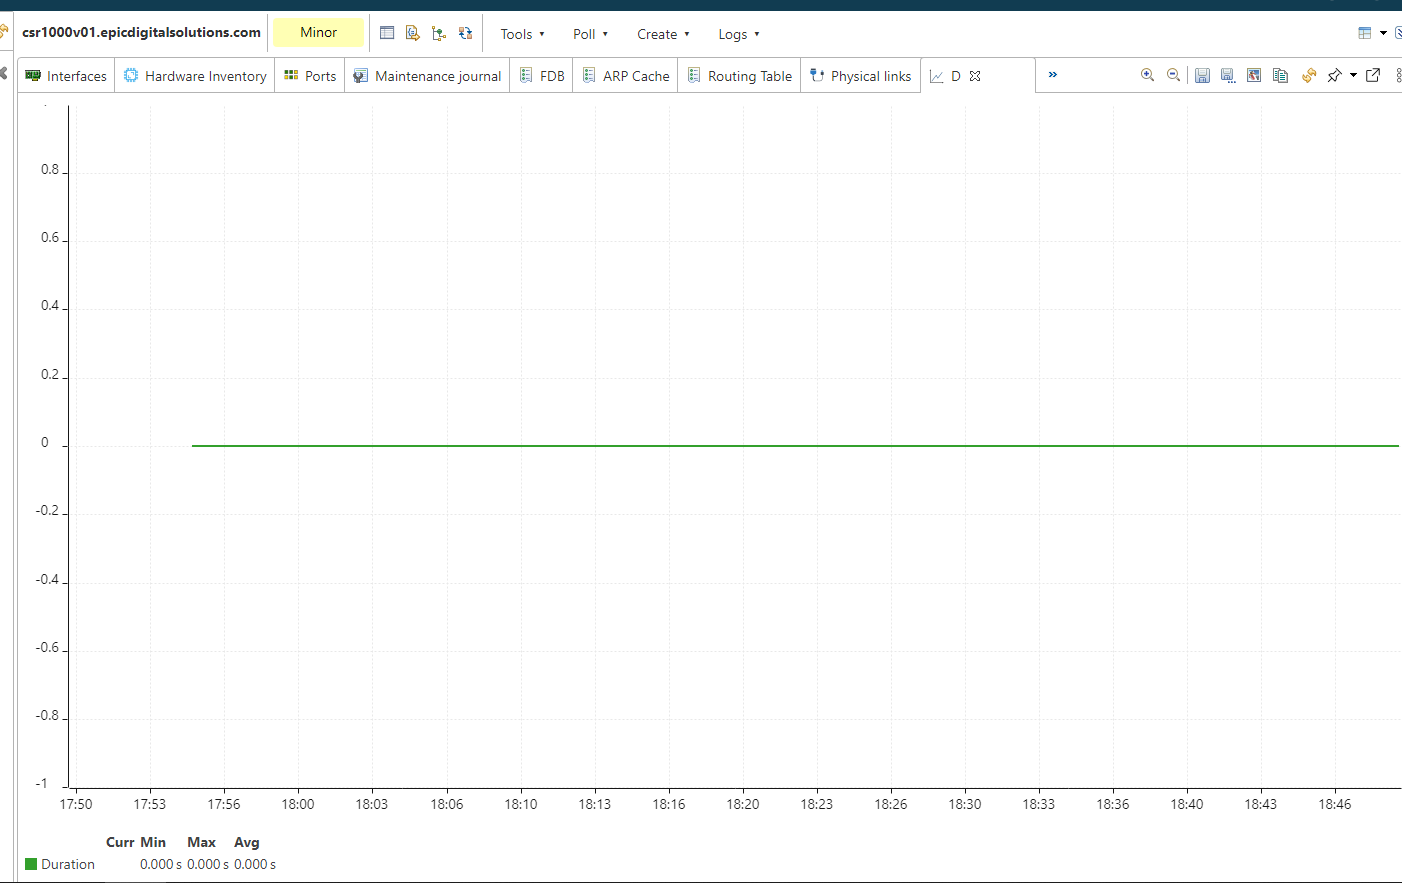
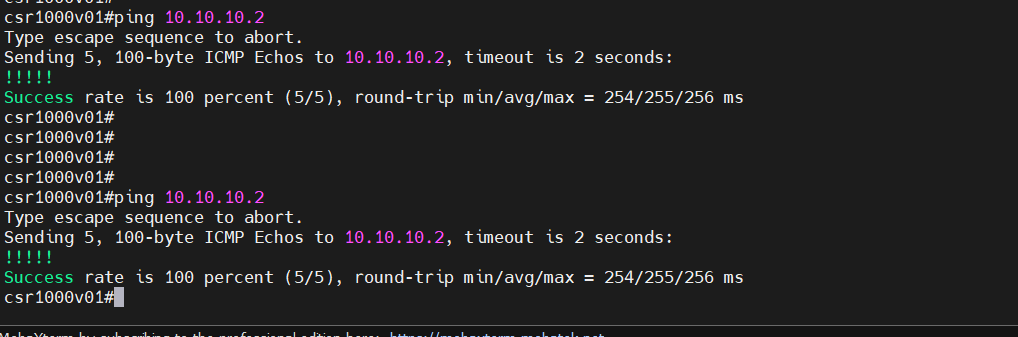
    I tried testing with SSH and also debugging netxms agent at the same. I see the following debug output(ping) but the DCI just keep showing zero(ping2). When I ping the same remote endpoint from the source router(ping3) the response time is much higher. Not sure what the problem is. Or am I  not outputting the result properly ?


    ping.PNG

    ping2.PNG

    ping3.PNG


  • ISP Connectivity Monitoring with ICMP
    C chidex
    Support

    @filipp-sudanov said in ISP Connectivity Monitoring with ICMP:

    NetXMS can connect via ssh, send some command and get first line of output of that command as DCI value. See more here: https://netxms.org/documentation/adminguide/ssh-monitoring.html
    For SNMP you just need to create a new DCI with origin SNMP and put OID into the Metric field.
    However, I can not tell if your specific device can perform pinging and report value via mentioned methods. Ssh is probably more promising, as typically ping command is present on devices.

    Thank you for providing feedback.Am using Its HPE router and Cisco router . I will try the ssh versions as it appears to be more like what can be done easily. Do you also mean there is SNMP OID to use to extract ICMP data on remote device by this statement - "For SNMP you just need to create a new DCI with origin SNMP and put OID into the Metric field.".?


  • ISP Connectivity Monitoring with ICMP
    C chidex
    Support

    @filipp-sudanov said in ISP Connectivity Monitoring with ICMP:

    Depending on what that router supports. If you could install NetXMS agent there, that would be the best way - e.g. this can be done with some newer Mikrotiks that support containers. If not, then you can collect data via snmp or ssh. Or you can put some machine with netxms agent in the proximity of this router.

    Thank you Filipp, nothing can be installed on the router. You mentioned this can be achieved using ssh and SNMP. Do you mind throwing more light.


  • ISP Connectivity Monitoring with ICMP
    C chidex
    Support

    I have wondered if there is a better way to monitor ISP connectivity using ICMP - latency, packet loss and RTT. The challenge is that when ICMP request is sent from netxms server to ISP, the result is usually affected by underlying LAN network and doesn't give true picture to measure from the Edge Router (Source) to ISP end (destination). Is there a way to achieve this using Netxms where the router becomes the source to send ICMP echo request.


  • Using Web API to retrieve NetXMS Alarm data in Grafana
    C chidex
    Support

    Thank you. I had thought is particular to the plugin. It made more sense now. Trying this out. Appreciate the input.


  • Using Web API to retrieve NetXMS Alarm data in Grafana
    C chidex
    Support

    Hi Tatjana,

    Thank you soooo much. it worked. I resorted to using option 2 since I am using newer version of grafana and it does appear the plugin is deprecated on newer grafana version


  • Using Web API to retrieve NetXMS Alarm data in Grafana
    C chidex
    Support

    Hi

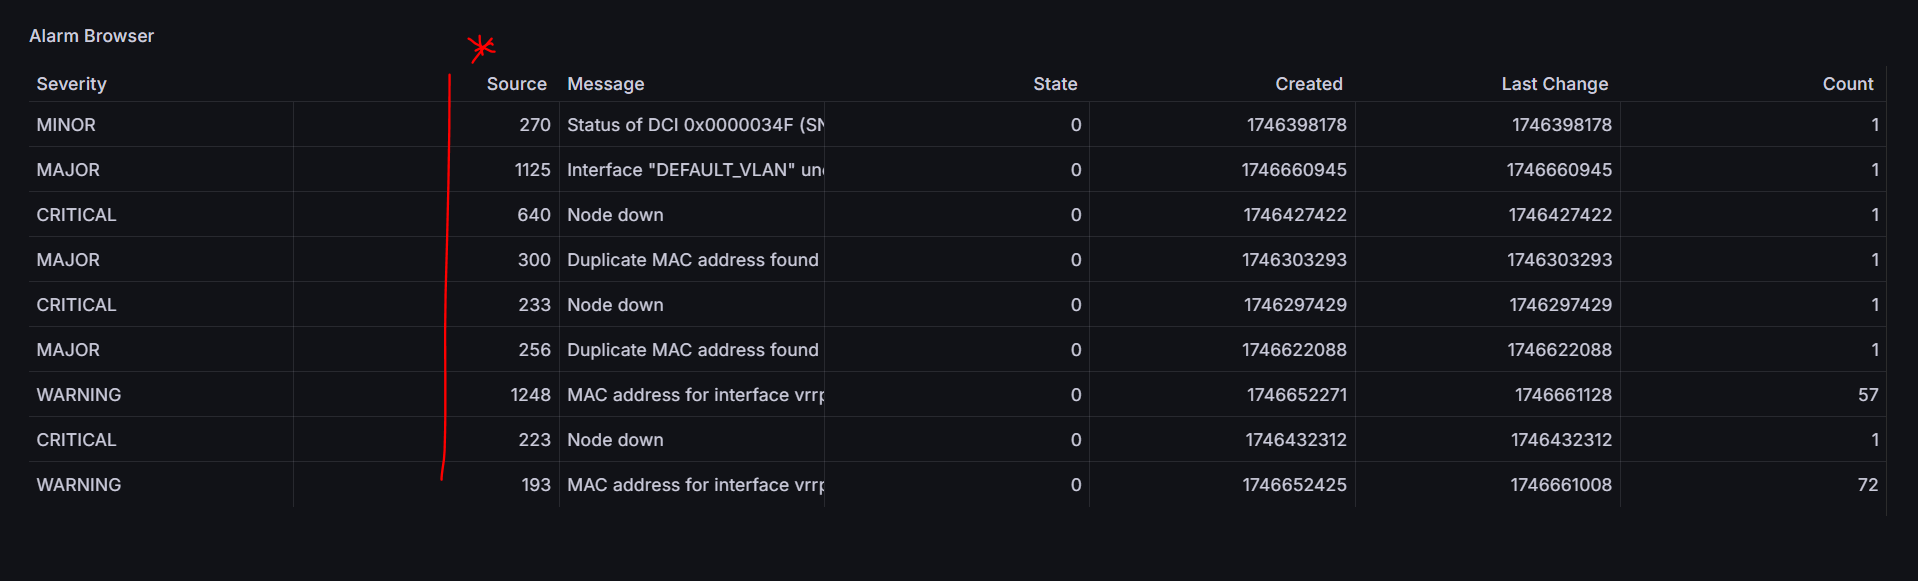
    Am trying to replicate this dashboard https://netxms.org/documentation/adminguide/_images/grafana-alarm-browser.png by making API calls. Am able to get some data in but I cant see any API that retrieves the node name. All I see is the object ID as seen below. Is  there a way to get it to show the actual device name and not just ID. This is my API http://x.x.x.x:8080/webapi/alarms


    sample.PNG

  • Login

  • Don't have an account? Register

  • Login or register to search.
Powered by NodeBB Contributors
  • First post
    Last post
0
  • Categories
  • Recent
  • Tags
  • Popular
  • Users
  • Groups