
NetXMS CPU Usage High
-
@clifford said in NetXMS CPU Usage High:
Hi
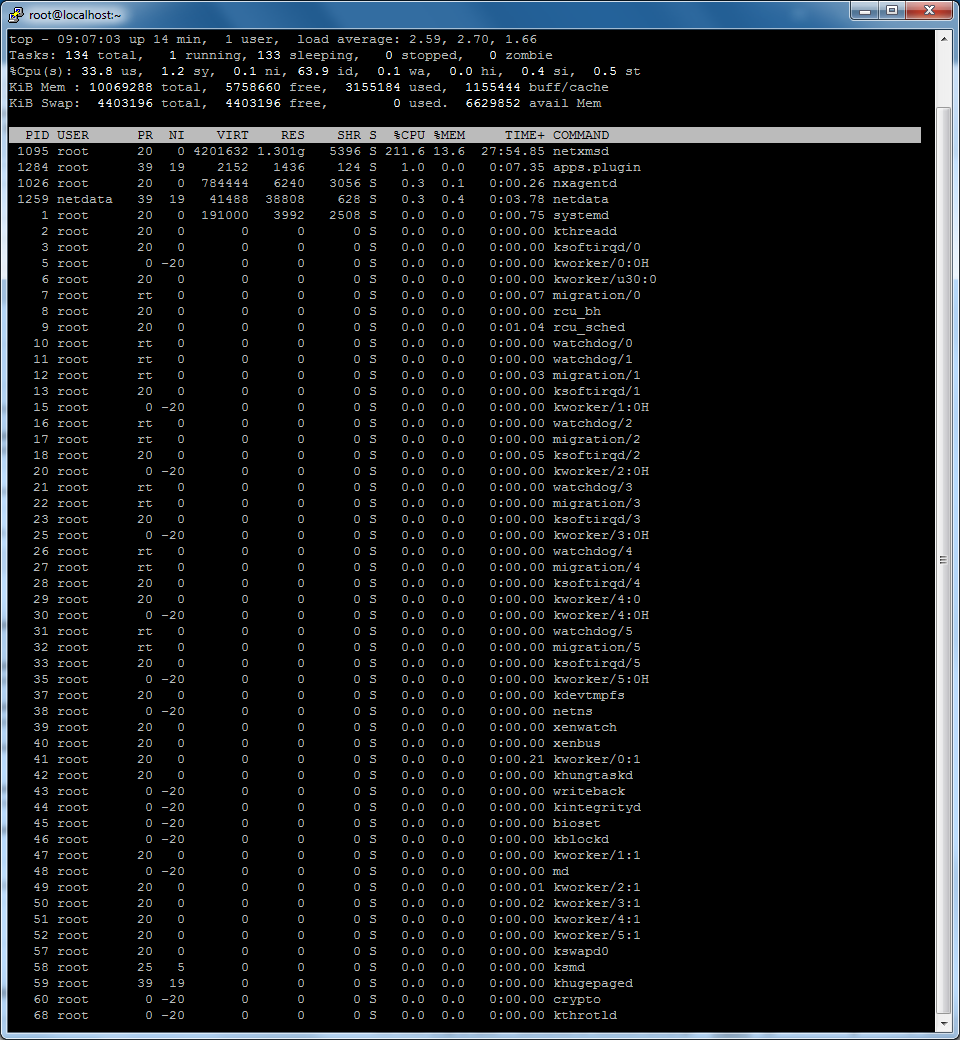
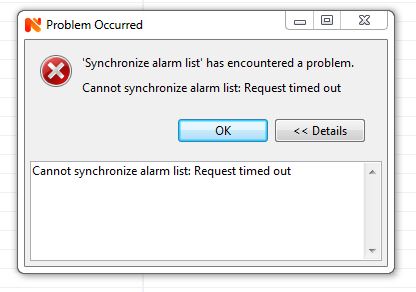
I just upgraded to 2.2.7 and the CPU usage is constantly high, and NetXMS is terribly slow. when i select alarns i get a requet timed out message (attached)
-----------------------------------------------------------------------------------
[root@localhost ~]# nxdbmgr -v
NetXMS Database Manager Version 2.2.7 Build 9513 (2.2.7) (UNICODE)
-----------------------------------------------------------------------------------
netxmsd: show dbstats
SQL query counters:
Total .......... 8677913
SELECT ......... 324464
Non-SELECT ..... 8353449
Long running ... 0
Failed ......... 0
Background writer requests:
DCI data ....... 57904
DCI raw data ... 57903
Others ......... 59
---------------------------------------------------------------------------------------
netxmsd: show queues
Data collector : 0
DCI cache loader : 0
Template updates : 0
Database writer : 0
Database writer (IData) : 0
Database writer (raw DCI values) : 1808
Event processor : 0
Event log writer : 0
Poller : 0
Node discovery poller : 0
Syslog processing : 0
Syslog writer : 0
Scheduler : 0
------------------------------------------------------------
netxmsd: show stats
Objects............ 34904
Monitored nodes.... 1113
Collectible DCIs... 2191
Active alarms...... 168
__________________
netxmsd: show statsTodays show stats
Objects............ 34955
Monitored nodes.... 1115
Collectible DCIs... 2191
Active alarms...... 218what may be causing this, please help
Regards
Clifford Dsouza
Can NetXMS use multi core CPU, ?
-
It sure can. We're running with 20 cores at present and our average load is around 9, but that's with over 200,000 DCIs.
You can tweak the number of threads being used for different tasks in your server configuration.
It sounds to me like you may not have enough threads configured. Monitor "show threads" in your server console to see if you need to tweak them.
I guess you'll probably want to increase the ThreadPool.Main.MaxSize (default is 256) as well as possibly the ThreadPool.Syncer.MaxSize (default is 1). -
Thanks,
i changed the values to 512, hope this helps..
however i could not find the ThreadPool.Syncer.MaxSize parameter in the server configuration., so i manually created one, when you say it should be greater than 1, what could be the recommended value based on the stats i posted.netxmsd: show threads
MAIN
Threads: 8 (8/512)
Load average: 0.00 0.00 0.00
Current load: 0%
Usage: 1%
Active requests: 0
Scheduled requests: 0POLLERS
Threads: 509 (10/512)
Load average: 51.59 54.84 62.20
Current load: 8%
Usage: 99%
Active requests: 44
Scheduled requests: 0DATACOLL
Threads: 250 (10/250)
Load average: 4.68 4.33 2.69
Current load: 0%
Usage: 100%
Active requests: 0
Scheduled requests: 0SCHEDULER
Threads: 1 (1/64)
Load average: 0.00 0.00 0.00
Current load: 0%
Usage: 1%
Active requests: 0
Scheduled requests: 0AGENT
Threads: 4 (4/256)
Load average: 0.00 0.00 0.00
Current load: 0%
Usage: 1%
Active requests: 0
Scheduled requests: 0Thanks
Clifford
-
ThreadPool.Syncer.MaxSize does indeed not show in the standard configuration. You will also need to restart the server after you change it.
Set it to a value like 4 or 8, then have a look at how it behaves. You can see if the settings are active by checking the "show threads" command.The Syncer threads are used whenever NetXMS actually writes object changes to the database, the interval between writes is defined in the SyncInterval in the server configuration. Default is 60 seconds (which also means a server crash could lose you up to 60 seconds worth of data/changes). If your objects change a lot or you make changes to templates that affect a lot of nodes, the default single threaded Syncer could be a bottleneck. You can follow the progress of the syncer process if you enter "debug obj.sync 7" and "debug sync 7" in the server console, then check the netxmsd log file. Once the Syncer kicks in, it will log how many changes it needs to write and you can get an idea for how long it takes to do so. It's not a lot of extra messages, but useful information while you're making those changes.
For overall performance, the main threads are probably more relevant.
You can monitor the load of your thread pools by creating DCIs on your NetXMS server itself (using the "Internal" DCIs).
I suggest you monitor some of those to see where exactly you may need to adjust your settings. -
@clifford said in NetXMS CPU Usage High:
Thanks,
i changed the values to 512, hope this helps..
however i could not find the ThreadPool.Syncer.MaxSize parameter in the server configuration., so i manually created one, when you say it should be greater than 1, what could be the recommended value based on the stats i posted.netxmsd: show threads
MAIN
Threads: 8 (8/512)
Load average: 0.00 0.00 0.00
Current load: 0%
Usage: 1%
Active requests: 0
Scheduled requests: 0POLLERS
Threads: 509 (10/512)
Load average: 51.59 54.84 62.20
Current load: 8%
Usage: 99%
Active requests: 44
Scheduled requests: 0DATACOLL
Threads: 250 (10/250)
Load average: 4.68 4.33 2.69
Current load: 0%
Usage: 100%
Active requests: 0
Scheduled requests: 0SCHEDULER
Threads: 1 (1/64)
Load average: 0.00 0.00 0.00
Current load: 0%
Usage: 1%
Active requests: 0
Scheduled requests: 0AGENT
Threads: 4 (4/256)
Load average: 0.00 0.00 0.00
Current load: 0%
Usage: 1%
Active requests: 0
Scheduled requests: 0Thanks
Clifford
When everything is fine and the CPU is at 3% to 25 % Usage
netxmsd: show threads
MAIN
Threads: 36 (8/512)
Load average: 0.00 0.00 0.00
Current load: 0%
Usage: 7%
Active requests: 0
Scheduled requests: 0POLLERS
Threads: 510 (10/512)
Load average: 41.75 112.32 76.88
Current load: 44%
Usage: 99%
Active requests: 226
Scheduled requests: 0DATACOLL
Threads: 249 (10/250)
Load average: 0.72 6.04 4.81
Current load: 0%
Usage: 99%
Active requests: 2
Scheduled requests: 0SCHEDULER
Threads: 1 (1/64)
Load average: 0.00 0.00 0.00
Current load: 0%
Usage: 1%
Active requests: 0
Scheduled requests: 0AGENT
Threads: 4 (4/256)
Load average: 0.00 0.00 0.00
Current load: 0%
Usage: 1%
Active requests: 0
Scheduled requests: 0SYNCER
Threads: 10 (1/10)
Load average: 17.84 29.54 14.71
Current load: 0%
Usage: 100%
Active requests: 0
Scheduled requests: 0When things are bad

netxmsd: show threads
MAIN
Threads: 2048 (8/2048)
Load average: 2996493.60 2968151.86 2119779.01
Current load: 145523%
Usage: 100%
Active requests: 2980327
Scheduled requests: 0POLLERS
Threads: 1003 (10/1024)
Load average: 51.45 48.24 45.01
Current load: 5%
Usage: 97%
Active requests: 51
Scheduled requests: 0DATACOLL
Threads: 512 (10/512)
Load average: 5.44 2.90 1.57
Current load: 0%
Usage: 100%
Active requests: 0
Scheduled requests: 0SCHEDULER
Threads: 1 (1/64)
Load average: 0.00 0.00 0.00
Current load: 0%
Usage: 1%
Active requests: 0
Scheduled requests: 0AGENT
Threads: 4 (4/256)
Load average: 0.00 0.00 0.00
Current load: 0%
Usage: 1%
Active requests: 0
Scheduled requests: 0SYNCER
Threads: 7 (1/10)
Load average: 0.00 1.44 5.04
Current load: 0%
Usage: 70%
Active requests: 0
Scheduled requests: 0 -
@clifford said in NetXMS CPU Usage High:
@clifford said in NetXMS CPU Usage High:
Thanks,
i changed the values to 512, hope this helps..
however i could not find the ThreadPool.Syncer.MaxSize parameter in the server configuration., so i manually created one, when you say it should be greater than 1, what could be the recommended value based on the stats i posted.netxmsd: show threads
MAIN
Threads: 8 (8/512)
Load average: 0.00 0.00 0.00
Current load: 0%
Usage: 1%
Active requests: 0
Scheduled requests: 0POLLERS
Threads: 509 (10/512)
Load average: 51.59 54.84 62.20
Current load: 8%
Usage: 99%
Active requests: 44
Scheduled requests: 0DATACOLL
Threads: 250 (10/250)
Load average: 4.68 4.33 2.69
Current load: 0%
Usage: 100%
Active requests: 0
Scheduled requests: 0SCHEDULER
Threads: 1 (1/64)
Load average: 0.00 0.00 0.00
Current load: 0%
Usage: 1%
Active requests: 0
Scheduled requests: 0AGENT
Threads: 4 (4/256)
Load average: 0.00 0.00 0.00
Current load: 0%
Usage: 1%
Active requests: 0
Scheduled requests: 0Thanks
Clifford
When everything is fine and the CPU is at 3% to 25 % Usage
netxmsd: show threads
MAIN
Threads: 36 (8/512)
Load average: 0.00 0.00 0.00
Current load: 0%
Usage: 7%
Active requests: 0
Scheduled requests: 0POLLERS
Threads: 510 (10/512)
Load average: 41.75 112.32 76.88
Current load: 44%
Usage: 99%
Active requests: 226
Scheduled requests: 0DATACOLL
Threads: 249 (10/250)
Load average: 0.72 6.04 4.81
Current load: 0%
Usage: 99%
Active requests: 2
Scheduled requests: 0SCHEDULER
Threads: 1 (1/64)
Load average: 0.00 0.00 0.00
Current load: 0%
Usage: 1%
Active requests: 0
Scheduled requests: 0AGENT
Threads: 4 (4/256)
Load average: 0.00 0.00 0.00
Current load: 0%
Usage: 1%
Active requests: 0
Scheduled requests: 0SYNCER
Threads: 10 (1/10)
Load average: 17.84 29.54 14.71
Current load: 0%
Usage: 100%
Active requests: 0
Scheduled requests: 0When things are bad
netxmsd: show threads
MAIN
Threads: 2048 (8/2048)
Load average: 2996493.60 2968151.86 2119779.01
Current load: 145523%
Usage: 100%
Active requests: 2980327
Scheduled requests: 0POLLERS
Threads: 1003 (10/1024)
Load average: 51.45 48.24 45.01
Current load: 5%
Usage: 97%
Active requests: 51
Scheduled requests: 0DATACOLL
Threads: 512 (10/512)
Load average: 5.44 2.90 1.57
Current load: 0%
Usage: 100%
Active requests: 0
Scheduled requests: 0SCHEDULER
Threads: 1 (1/64)
Load average: 0.00 0.00 0.00
Current load: 0%
Usage: 1%
Active requests: 0
Scheduled requests: 0AGENT
Threads: 4 (4/256)
Load average: 0.00 0.00 0.00
Current load: 0%
Usage: 1%
Active requests: 0
Scheduled requests: 0SYNCER
Threads: 7 (1/10)
Load average: 0.00 1.44 5.04
Current load: 0%
Usage: 70%
Active requests: 0
Scheduled requests: 0

-
@clifford said in NetXMS CPU Usage High:
@clifford said in NetXMS CPU Usage High:
@clifford said in NetXMS CPU Usage High:
Thanks,
i changed the values to 512, hope this helps..
however i could not find the ThreadPool.Syncer.MaxSize parameter in the server configuration., so i manually created one, when you say it should be greater than 1, what could be the recommended value based on the stats i posted.netxmsd: show threads
MAIN
Threads: 8 (8/512)
Load average: 0.00 0.00 0.00
Current load: 0%
Usage: 1%
Active requests: 0
Scheduled requests: 0POLLERS
Threads: 509 (10/512)
Load average: 51.59 54.84 62.20
Current load: 8%
Usage: 99%
Active requests: 44
Scheduled requests: 0DATACOLL
Threads: 250 (10/250)
Load average: 4.68 4.33 2.69
Current load: 0%
Usage: 100%
Active requests: 0
Scheduled requests: 0SCHEDULER
Threads: 1 (1/64)
Load average: 0.00 0.00 0.00
Current load: 0%
Usage: 1%
Active requests: 0
Scheduled requests: 0AGENT
Threads: 4 (4/256)
Load average: 0.00 0.00 0.00
Current load: 0%
Usage: 1%
Active requests: 0
Scheduled requests: 0Thanks
Clifford
When everything is fine and the CPU is at 3% to 25 % Usage
netxmsd: show threads
MAIN
Threads: 36 (8/512)
Load average: 0.00 0.00 0.00
Current load: 0%
Usage: 7%
Active requests: 0
Scheduled requests: 0POLLERS
Threads: 510 (10/512)
Load average: 41.75 112.32 76.88
Current load: 44%
Usage: 99%
Active requests: 226
Scheduled requests: 0DATACOLL
Threads: 249 (10/250)
Load average: 0.72 6.04 4.81
Current load: 0%
Usage: 99%
Active requests: 2
Scheduled requests: 0SCHEDULER
Threads: 1 (1/64)
Load average: 0.00 0.00 0.00
Current load: 0%
Usage: 1%
Active requests: 0
Scheduled requests: 0AGENT
Threads: 4 (4/256)
Load average: 0.00 0.00 0.00
Current load: 0%
Usage: 1%
Active requests: 0
Scheduled requests: 0SYNCER
Threads: 10 (1/10)
Load average: 17.84 29.54 14.71
Current load: 0%
Usage: 100%
Active requests: 0
Scheduled requests: 0When things are bad
netxmsd: show threads
MAIN
Threads: 2048 (8/2048)
Load average: 2996493.60 2968151.86 2119779.01
Current load: 145523%
Usage: 100%
Active requests: 2980327
Scheduled requests: 0POLLERS
Threads: 1003 (10/1024)
Load average: 51.45 48.24 45.01
Current load: 5%
Usage: 97%
Active requests: 51
Scheduled requests: 0DATACOLL
Threads: 512 (10/512)
Load average: 5.44 2.90 1.57
Current load: 0%
Usage: 100%
Active requests: 0
Scheduled requests: 0SCHEDULER
Threads: 1 (1/64)
Load average: 0.00 0.00 0.00
Current load: 0%
Usage: 1%
Active requests: 0
Scheduled requests: 0AGENT
Threads: 4 (4/256)
Load average: 0.00 0.00 0.00
Current load: 0%
Usage: 1%
Active requests: 0
Scheduled requests: 0SYNCER
Threads: 7 (1/10)
Load average: 0.00 1.44 5.04
Current load: 0%
Usage: 70%
Active requests: 0
Scheduled requests: 0System stats
all this is just snmp traffic
things got normal when i quit the console and all is well since reconnecting the console again
Regards
Clifford -
@clifford said in NetXMS CPU Usage High:
@clifford said in NetXMS CPU Usage High:
@clifford said in NetXMS CPU Usage High:
@clifford said in NetXMS CPU Usage High:
Thanks,
i changed the values to 512, hope this helps..
however i could not find the ThreadPool.Syncer.MaxSize parameter in the server configuration., so i manually created one, when you say it should be greater than 1, what could be the recommended value based on the stats i posted.netxmsd: show threads
MAIN
Threads: 8 (8/512)
Load average: 0.00 0.00 0.00
Current load: 0%
Usage: 1%
Active requests: 0
Scheduled requests: 0POLLERS
Threads: 509 (10/512)
Load average: 51.59 54.84 62.20
Current load: 8%
Usage: 99%
Active requests: 44
Scheduled requests: 0DATACOLL
Threads: 250 (10/250)
Load average: 4.68 4.33 2.69
Current load: 0%
Usage: 100%
Active requests: 0
Scheduled requests: 0SCHEDULER
Threads: 1 (1/64)
Load average: 0.00 0.00 0.00
Current load: 0%
Usage: 1%
Active requests: 0
Scheduled requests: 0AGENT
Threads: 4 (4/256)
Load average: 0.00 0.00 0.00
Current load: 0%
Usage: 1%
Active requests: 0
Scheduled requests: 0Thanks
Clifford
When everything is fine and the CPU is at 3% to 25 % Usage
netxmsd: show threads
MAIN
Threads: 36 (8/512)
Load average: 0.00 0.00 0.00
Current load: 0%
Usage: 7%
Active requests: 0
Scheduled requests: 0POLLERS
Threads: 510 (10/512)
Load average: 41.75 112.32 76.88
Current load: 44%
Usage: 99%
Active requests: 226
Scheduled requests: 0DATACOLL
Threads: 249 (10/250)
Load average: 0.72 6.04 4.81
Current load: 0%
Usage: 99%
Active requests: 2
Scheduled requests: 0SCHEDULER
Threads: 1 (1/64)
Load average: 0.00 0.00 0.00
Current load: 0%
Usage: 1%
Active requests: 0
Scheduled requests: 0AGENT
Threads: 4 (4/256)
Load average: 0.00 0.00 0.00
Current load: 0%
Usage: 1%
Active requests: 0
Scheduled requests: 0SYNCER
Threads: 10 (1/10)
Load average: 17.84 29.54 14.71
Current load: 0%
Usage: 100%
Active requests: 0
Scheduled requests: 0When things are bad
netxmsd: show threads
MAIN
Threads: 2048 (8/2048)
Load average: 2996493.60 2968151.86 2119779.01
Current load: 145523%
Usage: 100%
Active requests: 2980327
Scheduled requests: 0POLLERS
Threads: 1003 (10/1024)
Load average: 51.45 48.24 45.01
Current load: 5%
Usage: 97%
Active requests: 51
Scheduled requests: 0DATACOLL
Threads: 512 (10/512)
Load average: 5.44 2.90 1.57
Current load: 0%
Usage: 100%
Active requests: 0
Scheduled requests: 0SCHEDULER
Threads: 1 (1/64)
Load average: 0.00 0.00 0.00
Current load: 0%
Usage: 1%
Active requests: 0
Scheduled requests: 0AGENT
Threads: 4 (4/256)
Load average: 0.00 0.00 0.00
Current load: 0%
Usage: 1%
Active requests: 0
Scheduled requests: 0SYNCER
Threads: 7 (1/10)
Load average: 0.00 1.44 5.04
Current load: 0%
Usage: 70%
Active requests: 0
Scheduled requests: 0System stats
all this is just snmp traffic
things got normal when i quit the console and all is well since reconnecting the console again
Regards
Clifford
Sadly had to quite the management console again, tried with the 32 bit console also, after few minutes the system goes for a toss againRegards
Clifford -
Hi,
please do the following:
- Enter
debug client.* 6
in server console. This will turn on debug of incoming client requests.
-
Connect with console and wait for CPU to go up.
-
Capture threads using attached script (you should have gdb and all relevant netxms-*-dbg packages installed).
Send me thread dump (will be in /tmp) and server log file (part for the duration of client session).
Best regards,
Victor -
Hi Victor
thanks for ur reply, i need clarity on the 3rd point
- Capture threads using attached script (you should have gdb and all relevant netxms-*-dbg packages installed
how do i verify i have gdb and dbg packages installed , i did the standard netxms install on centos 7.
beside that i dont see any attached scripts, and an example how to capture the threads
Regards
Clifford
- Capture threads using attached script (you should have gdb and all relevant netxms-*-dbg packages installed
-
Hi,
sorry, I forgot to attach script. Now it's attached. Script expects netxmsd to be in your PATH. If it is not, change 'netxmsd' in script's second line to full path to netxmsd.
On Centos you likely build NetXMS from sources - then debug information is embedded into binaries. You only have to install gdb package if not installed already:
yum install gdb
Best regards,
Victor
-
Hi Victor,
Please find the attached scripts output for your reference.
Best Regards
Clifford
-
Are you sure that CPU usage was high when you capture this dump? I see lot of locks inside (that could be an indicator of another problem) but cannot find anything that can cause high CPU load.
Best regards,
Victor -
Just found the place. Seems that server enters infinite loop deep within libz (compression library). Check if new version is available. Also, you can try to rebuild server with configure option --with-internal-zlib.
Best regards,
Victor -
Hi Victor,
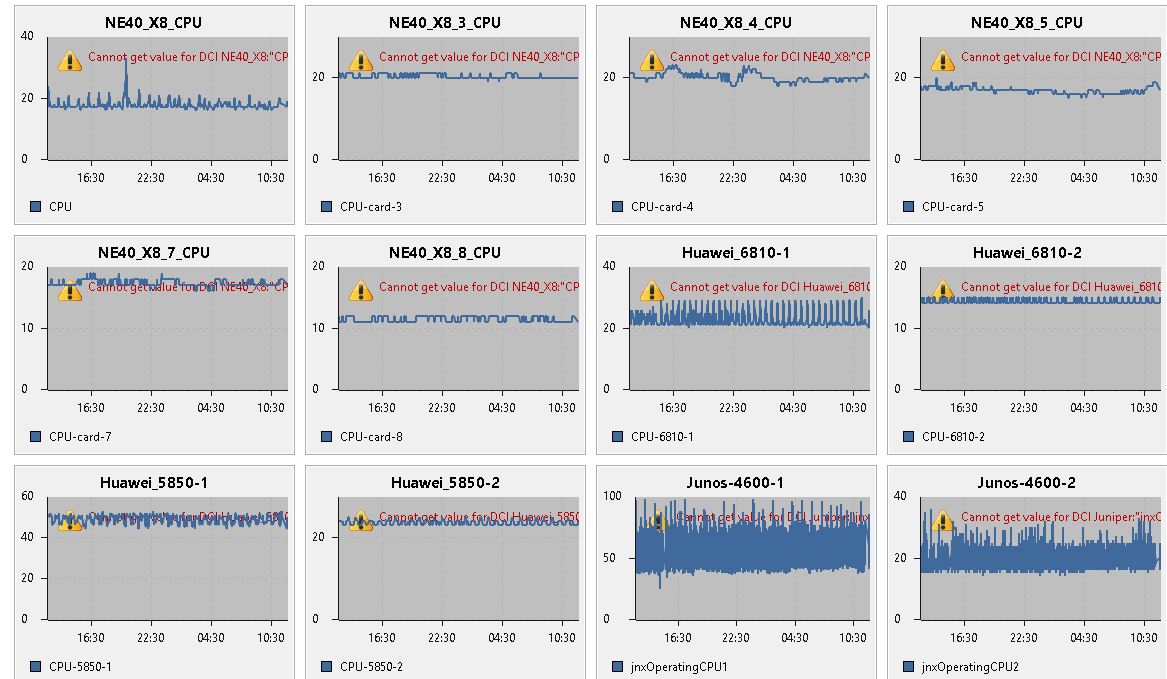
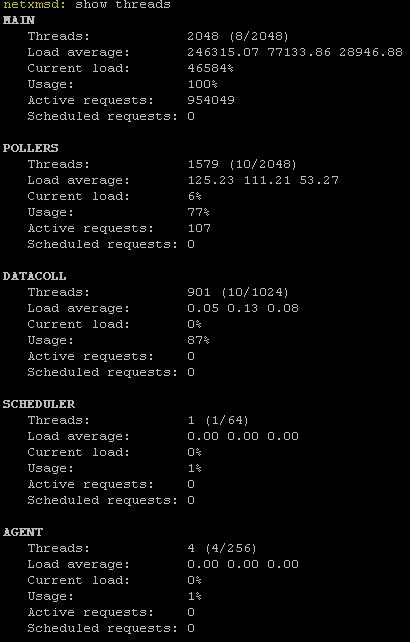
I rebuild the server with-zlib option but situation is same. after few minutes CPU goes high. I have captured the threads with script which you had shared earlier. Please find the attached screenshot with thread output files.
Thank you
Clifford.
-
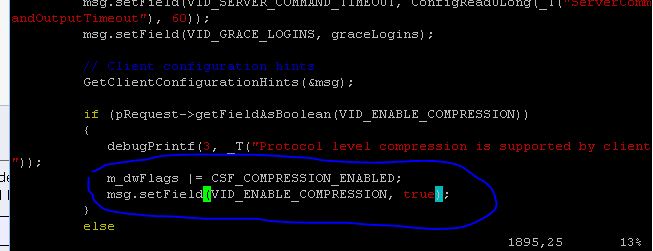
It hangs in same place. It looks like zlib bug, for deeper debugging we need actual data being compressed. As a workaround you can try to disable NXCP compression for client sessions by commenting out lines 1894 and 1895 (should looks like
            m_dwFlags |= CSF_COMPRESSION_ENABLED;
            msg.setField(VID_ENABLE_COMPRESSION, true);
in src/server/core/session.cpp and recompile server.
Best regards,
Victor -
-
No, they are not. Put // in front of each line.
Best regards,
Victor -
Hi Victor,
I recompiled after commenting out the 2 lines as suggested. However the problem remains the same.
Actually we have 2 different Servers for which we recently upgraded from 2.2.5 to 2.2.7 one of these server is running fine after upgrade. Issue is with only this Server, earlier this Server was working Good.Thank you
Clifford -
Hello! It looks like you're interested in this conversation, but you don't have an account yet.
Getting fed up of having to scroll through the same posts each visit? When you register for an account, you'll always come back to exactly where you were before, and choose to be notified of new replies (either via email, or push notification). You'll also be able to save bookmarks and upvote posts to show your appreciation to other community members.
With your input, this post could be even better 💗
Register Login