
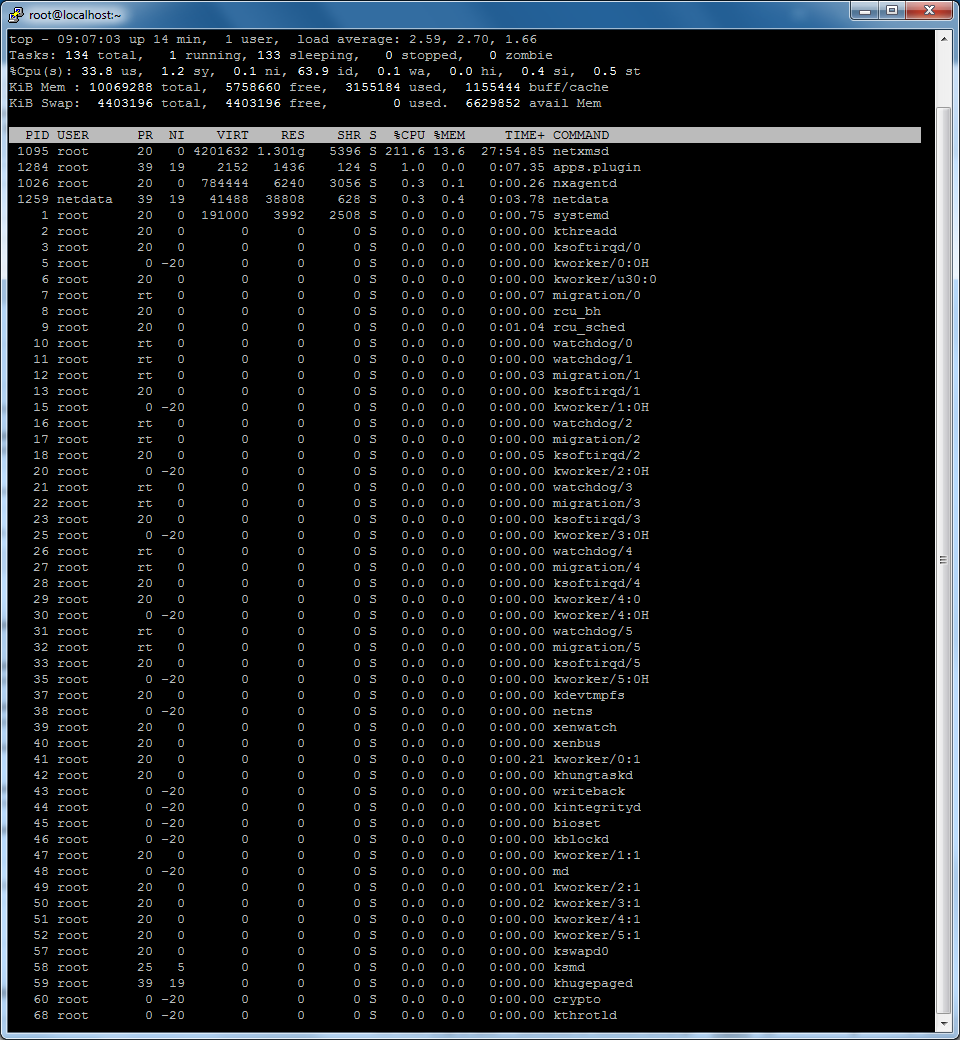
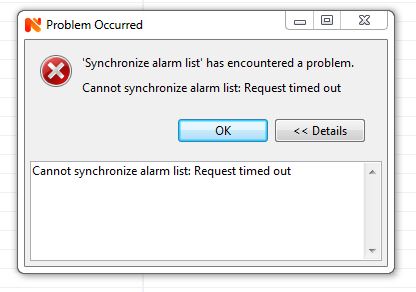
NetXMS CPU Usage High
-
Hi Victor,
Please find the attached scripts output for your reference.
Best Regards
Clifford
-
Are you sure that CPU usage was high when you capture this dump? I see lot of locks inside (that could be an indicator of another problem) but cannot find anything that can cause high CPU load.
Best regards,
Victor -
Just found the place. Seems that server enters infinite loop deep within libz (compression library). Check if new version is available. Also, you can try to rebuild server with configure option --with-internal-zlib.
Best regards,
Victor -
Hi Victor,
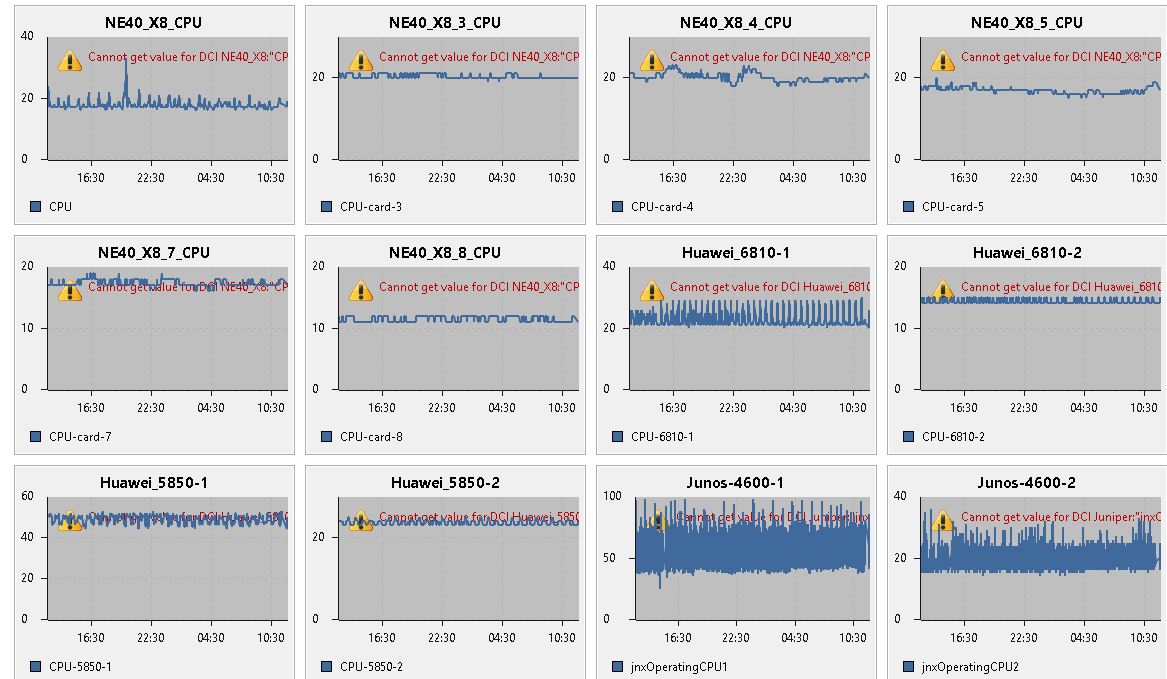
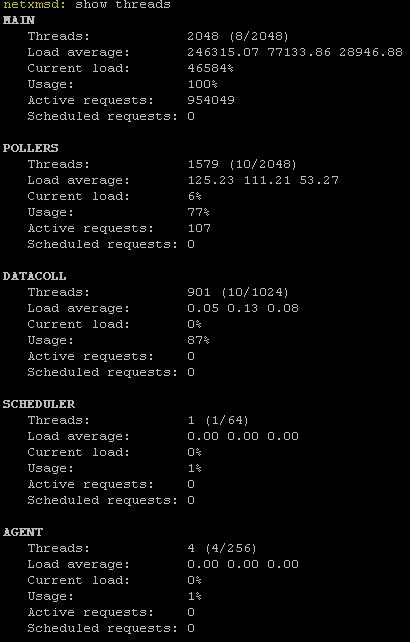
I rebuild the server with-zlib option but situation is same. after few minutes CPU goes high. I have captured the threads with script which you had shared earlier. Please find the attached screenshot with thread output files.
Thank you
Clifford.
-
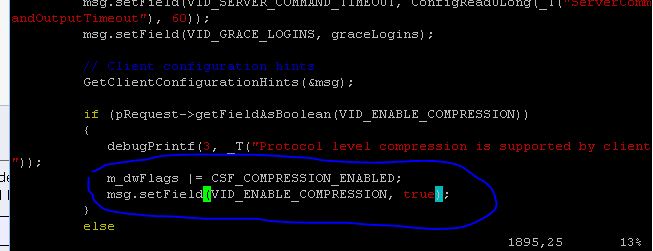
It hangs in same place. It looks like zlib bug, for deeper debugging we need actual data being compressed. As a workaround you can try to disable NXCP compression for client sessions by commenting out lines 1894 and 1895 (should looks like
            m_dwFlags |= CSF_COMPRESSION_ENABLED;
            msg.setField(VID_ENABLE_COMPRESSION, true);
in src/server/core/session.cpp and recompile server.
Best regards,
Victor -
-
No, they are not. Put // in front of each line.
Best regards,
Victor -
Hi Victor,
I recompiled after commenting out the 2 lines as suggested. However the problem remains the same.
Actually we have 2 different Servers for which we recently upgraded from 2.2.5 to 2.2.7 one of these server is running fine after upgrade. Issue is with only this Server, earlier this Server was working Good.Thank you
Clifford -
-
What is difference between servers? Number of nodes, different OS?
-
Hi Tatjana,
Both Servers are Virtual with same configuration and OS (Centos 7). Please see the node stats of both Server below.
Server with issue:
NetXMS Server Remote Console V2.2.7 Ready
Enter "help" for command listnetxmsd: show stats
Objects............ 35197
Monitored nodes.... 1122
Collectible DCIs... 2146
Active alarms...... 416Server working fine:
NetXMS Server Remote Console V2.2.7 Ready
Enter "help" for command listnetxmsd: show stats
Objects............ 32410
Monitored nodes.... 853
Collectible DCIs... 288
Active alarms...... 232Thanks
Clifford -
Looks like you have really a lot of object updates and server is unable to delivere all updates to the client so everything just stuck. I'll rework object update messages, but can't promise the release number where it will get in.
-
Hi
I didn't get the "server is unable to deliver all updates to the client" part, cause almost all objects are switches and routers, so all we expect from the NMS is to report when the node or link is down. so all of it is SNMP Queries to the clients to check for update status
also it is important for me to view the link status as in my below query
https://www.netxms.org/forum/configuration/unable-to-get-bandwidth-details-on-map/msg23166/#msg23166
hope this gets implemented, it would be the greatest thing for me,
My NMS would be super complete

Regards
Clifford -
I believe Tatjana means updates to be sent from the server to the Management Console (client), i.e. either the server can't send new information to the client fast enough or the client can't accept it fast enough, thus throttling the server. Once that happens, the queue of updates to send just keeps increasing as it cannot catch up. It'll probably do that until the server runs out of resources and trips over - or until the console is closed. The latter explains why your server performance came good whenever you closed the console.
Have you considered using the Web Console for testing (sry, we're using Ubuntu, so can't give any guidance on the CentOS process)?
As that can be installed on the server itself, it would effectively remove the network from the server to console communication. -
-
I haven't run a NetXMS server on anything other than Ubuntu, so I really can't tell if this is any better/worse than the other options out there.
One of our reasons for using Ubuntu (other than personal preference) was the availability of NetXMS packages directly from the developers. -
Hi,
We have just upgraded Netxms Server to 2.2.8, now the response seems normal from Management console however CPU utilization is showing 300% and above, below are the stats after the upgrade. Just wanted to know if it is normal.
NetXMS Server Remote Console V2.2.8 Ready
Enter "help" for command listnetxmsd: show threads
MAIN
Threads.............. 256 (8/256)
Load average......... 7838118.55 7292039.09 5187107.27
Current load......... 3084405%
Usage................ 100%
Active requests...... 7896078
Scheduled requests... 0
Total requests....... 12741590
Thread starts........ 248
Thread stops......... 0
Average wait time.... 1641274 msPOLLERS
Threads.............. 250 (10/250)
Load average......... 103.76 109.10 117.88
Current load......... 83%
Usage................ 100%
Active requests...... 208
Scheduled requests... 0
Total requests....... 30786539
Thread starts........ 240
Thread stops......... 0
Average wait time.... 221 msDATACOLL
Threads.............. 96 (10/250)
Load average......... 4.58 5.48 5.53
Current load......... 1%
Usage................ 38%
Active requests...... 1
Scheduled requests... 0
Total requests....... 17575738
Thread starts........ 382
Thread stops......... 296
Average wait time.... 0 msSCHEDULER
Threads.............. 1 (1/64)
Load average......... 0.00 0.00 0.00
Current load......... 0%
Usage................ 1%
Active requests...... 0
Scheduled requests... 0
Total requests....... 1750
Thread starts........ 0
Thread stops......... 0
Average wait time.... 0 msAGENT
Threads.............. 4 (4/256)
Load average......... 0.00 0.00 0.00
Current load......... 0%
Usage................ 1%
Active requests...... 0
Scheduled requests... 0
Total requests....... 0
Thread starts........ 0
Thread stops......... 0
Average wait time.... 0 msCLIENT
Threads.............. 16 (16/512)
Load average......... 0.00 0.00 0.00
Current load......... 0%
Usage................ 3%
Active requests...... 0
Scheduled requests... 0
Total requests....... 4586
Thread starts........ 0
Thread stops......... 0
Average wait time.... 0 msThank you
Clifford. -
Hi,
load on thread pool MAIN is definitely not normal. Could you please capture thread stack traces using attached script (you will need gdb installed)?
Best regards,
Victor
-
Hi,
Please find the output of script attached for your reference.
Thanks
Clifford
-
Hi,
looks like server is locked on sending object updates to one of user sessions. We encounter same issue in another installation recently and already changed object update notification mechanism in current development branch, so there are good chance that upgrade to 2.2.9 will fix your issue.
Best regards,
Victor
Hello! It looks like you're interested in this conversation, but you don't have an account yet.
Getting fed up of having to scroll through the same posts each visit? When you register for an account, you'll always come back to exactly where you were before, and choose to be notified of new replies (either via email, or push notification). You'll also be able to save bookmarks and upvote posts to show your appreciation to other community members.
With your input, this post could be even better 💗
Register Login